> ## Documentation Index
> Fetch the complete documentation index at: https://docs.decoart.com/llms.txt
> Use this file to discover all available pages before exploring further.
# Reports Submodule
## Overview
The **eCommerce** → **Reports** submodule helps you see how your ecommerce business is performing across all sales channels.
This module is especially useful for accounting teams, eCommerce managers, and operations staff who need to reconcile invoices and shipping totals, track performance, and monitor key metrics like order value, profit margin, and shipping time.
 ## Dashboard
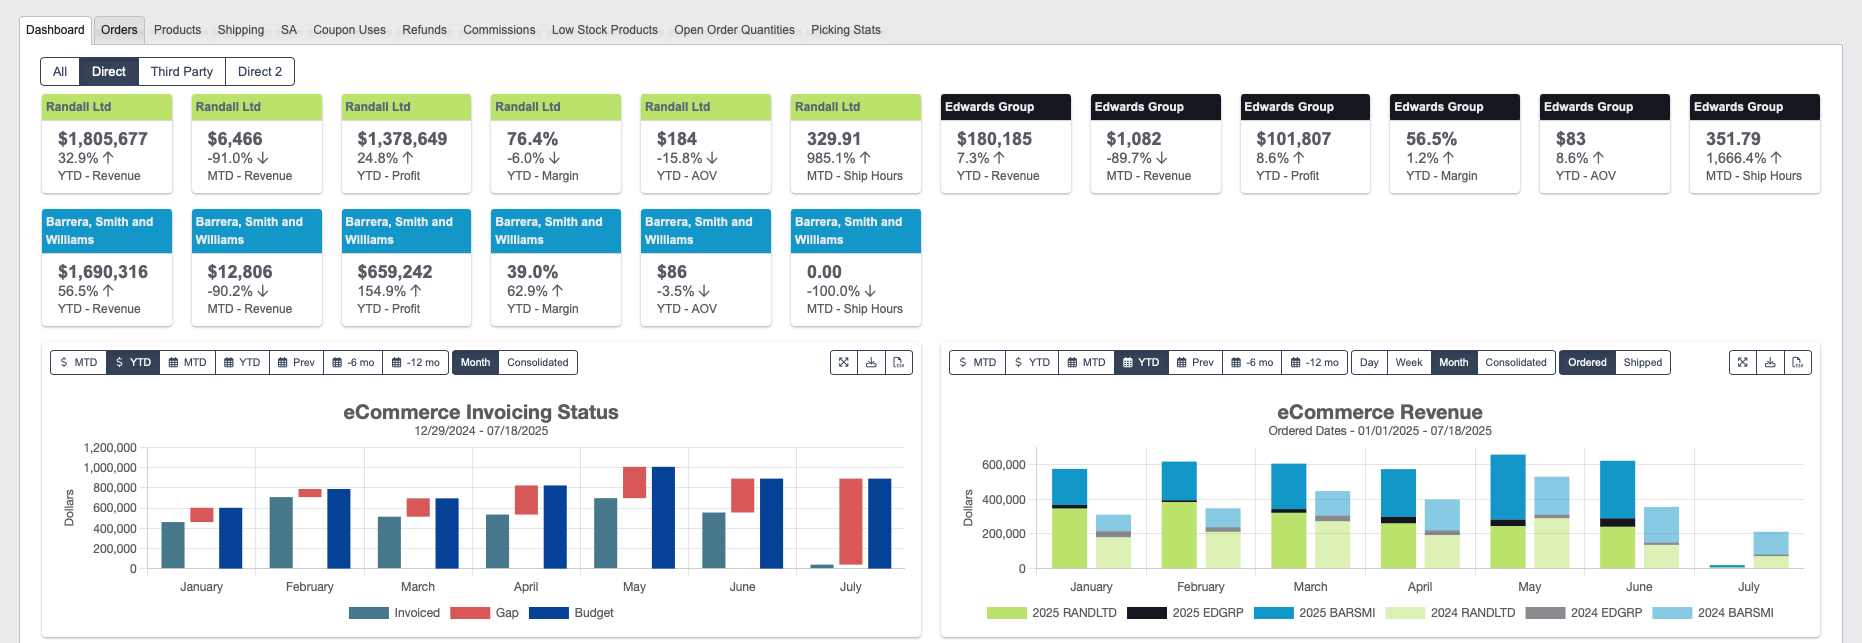
The `Dashboard` tab provides a high-level view of key performance indicators (KPIs).
Widgets display revenue, profit, margin, and average order value (AOV) for both month-to-date (MTD) and year-to-date (YTD) periods.
* The **dollar sign** (\$) icon in front of `MTD` or `YTD` indicates fiscal time periods. For example, clicking on `$ MTD` will filter the data by your **accounting** month-to-date.
Fiscal periods could be different between companies and don’t necessarily match up with a calendar month.
* The **calendar** icon shows standard calendar time periods.
The Reports Dashboard supports zooming, hiding data series, and exporting widgets as CSV files. Chart widgets also download as PNG images, and table widgets such as `Top Products` and `Shorted Products` download as Excel files.
## Generate Reports
The other tabs let you display information on `Orders`, `Products`, and more, filtered by attributes like customer, date, and status.
To display information on Orders for example:
1. Click on the `Orders` tab.
2. Choose a `Channel`, usually corresponding to a vendor or customer.
3. Filter orders by `Start` and `End` dates, or choose a pre-set time period such as month-to-date (MTD).
4. Choose the `data type` to filter for.
5. Click `Generate Report` to view the filtered data in a table.
6. You can choose to perform the following actions on the table:
a. Click on an `Order ID` or `Order Number` to view detailed order information.
b. Click on a column header to sort the table by that attribute.
c. Use the table’s toolbar to download or print the table’s data.
## Dashboard
The `Dashboard` tab provides a high-level view of key performance indicators (KPIs).
Widgets display revenue, profit, margin, and average order value (AOV) for both month-to-date (MTD) and year-to-date (YTD) periods.
* The **dollar sign** (\$) icon in front of `MTD` or `YTD` indicates fiscal time periods. For example, clicking on `$ MTD` will filter the data by your **accounting** month-to-date.
Fiscal periods could be different between companies and don’t necessarily match up with a calendar month.
* The **calendar** icon shows standard calendar time periods.
The Reports Dashboard supports zooming, hiding data series, and exporting widgets as CSV files. Chart widgets also download as PNG images, and table widgets such as `Top Products` and `Shorted Products` download as Excel files.
## Generate Reports
The other tabs let you display information on `Orders`, `Products`, and more, filtered by attributes like customer, date, and status.
To display information on Orders for example:
1. Click on the `Orders` tab.
2. Choose a `Channel`, usually corresponding to a vendor or customer.
3. Filter orders by `Start` and `End` dates, or choose a pre-set time period such as month-to-date (MTD).
4. Choose the `data type` to filter for.
5. Click `Generate Report` to view the filtered data in a table.
6. You can choose to perform the following actions on the table:
a. Click on an `Order ID` or `Order Number` to view detailed order information.
b. Click on a column header to sort the table by that attribute.
c. Use the table’s toolbar to download or print the table’s data.