> ## Documentation Index
> Fetch the complete documentation index at: https://docs.decoart.com/llms.txt
> Use this file to discover all available pages before exploring further.
# Navigating the Interface
## Overview
This guide outlines the common user interface elements available throughout many DASH pages and helps you quickly navigate, customize, and export data across modules.
## Sidebar
What you see in DASH depends on your role:
* If you have an administrative or back-office role (e.g., accounting, sales, customer service), you’ll see the Dashboard and sidebar with access to your assigned modules.
* If you have a production floor role (e.g., order selector, material handler, work order operator), you’ll see a different interface designed for your handheld device. You won’t see the sidebar.
The **sidebar** is located to the left of the DASH interface, and gives you access to DASH’s modules in alphabetical order, along with the **Dashboard**. The sidebar is customized to your user permissions, so your sidebar may look different than the following example.
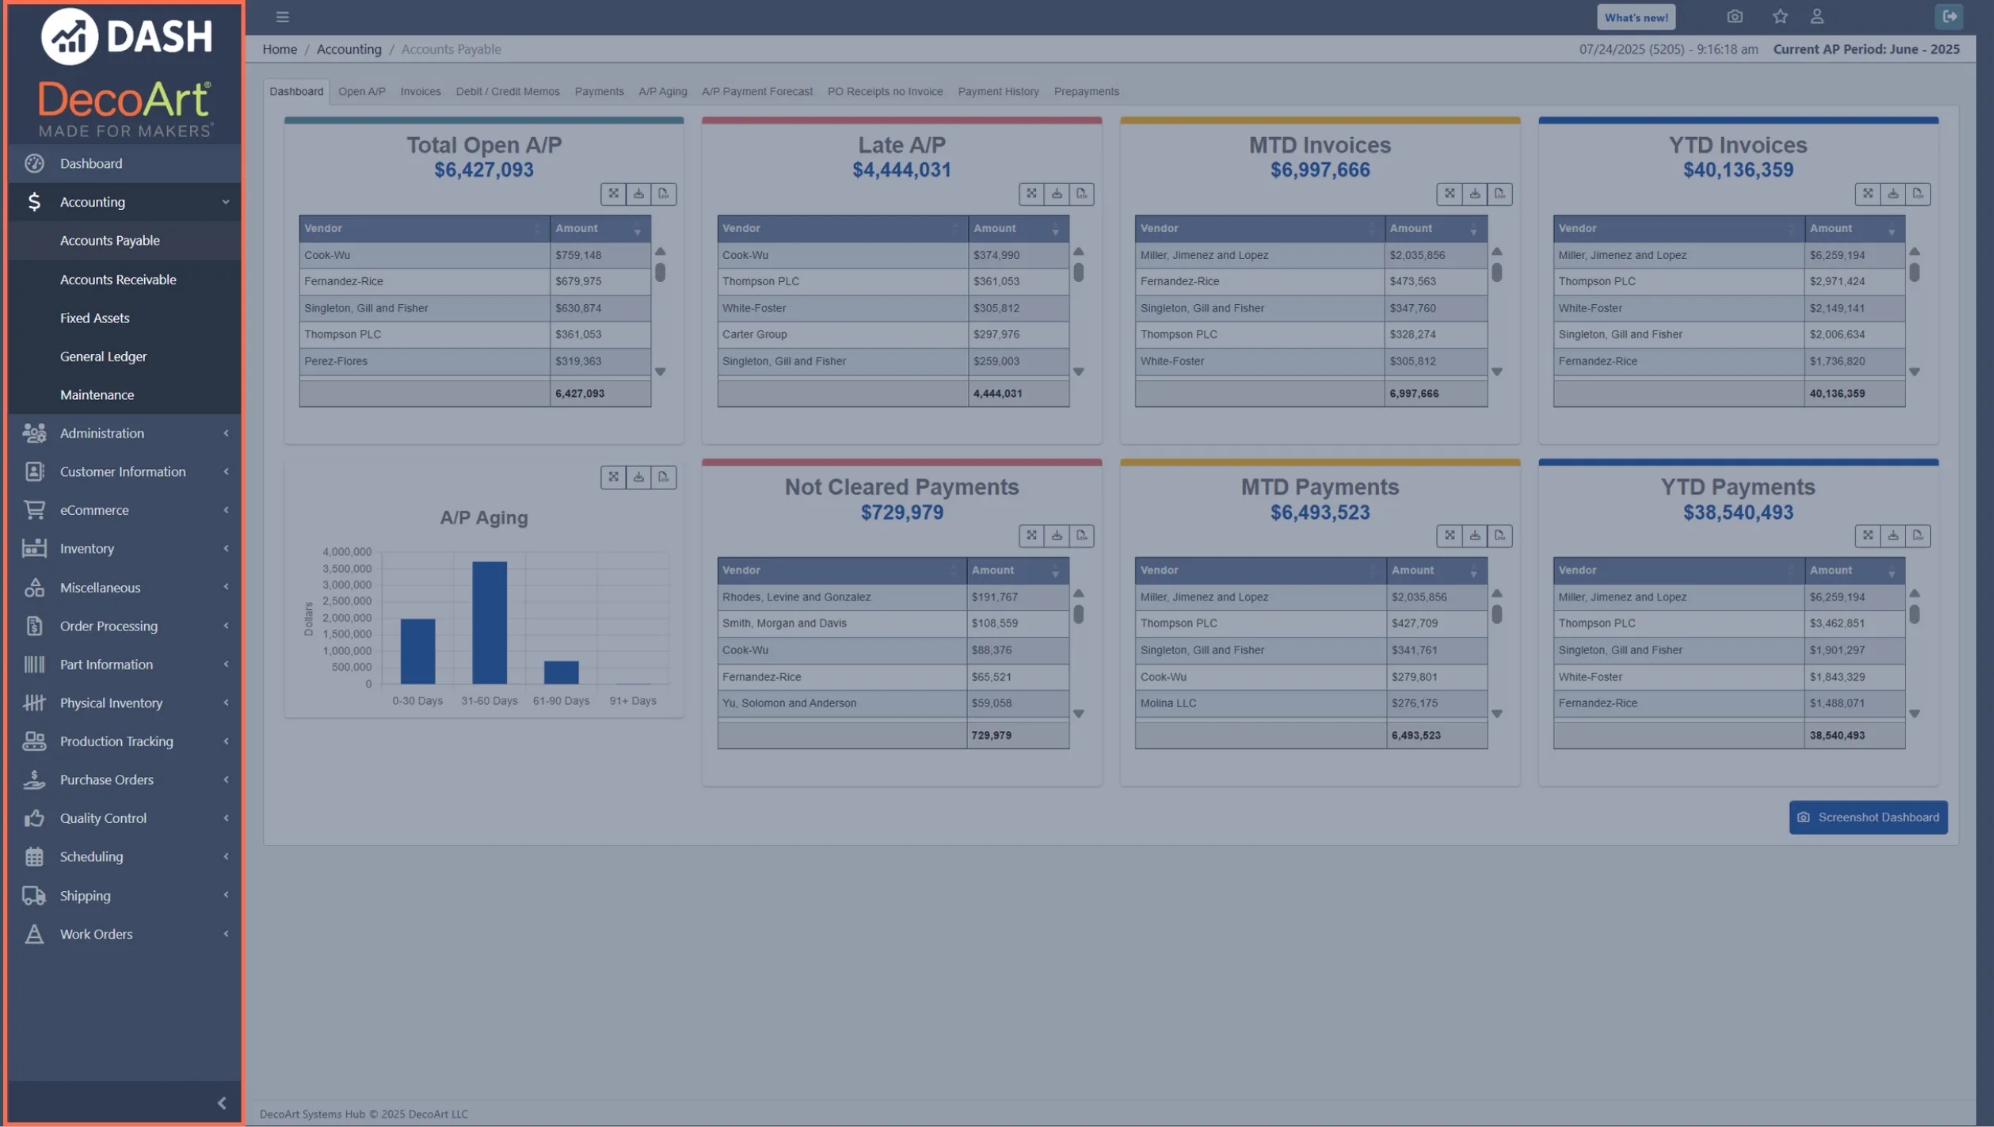 The sidebar provides the following options:
* **DASH** Icon: Go to your Dashboard.
* **Your Company** Icon: Change what company’s DASH instance you are viewing. You will likely only have access to one DASH instance.
* `Dashboard` : Go to your Dashboard.
* Click on any module (such as `Accounting`) to view its **submodules** (such as `Accounts Payable`). Click on a submodule to view its interface.
*
The sidebar provides the following options:
* **DASH** Icon: Go to your Dashboard.
* **Your Company** Icon: Change what company’s DASH instance you are viewing. You will likely only have access to one DASH instance.
* `Dashboard` : Go to your Dashboard.
* Click on any module (such as `Accounting`) to view its **submodules** (such as `Accounts Payable`). Click on a submodule to view its interface.
*
 Left-Arrow icon (bottom of sidebar): Click it to collapse the sidebar. Click it again to expand the sidebar.
*
Left-Arrow icon (bottom of sidebar): Click it to collapse the sidebar. Click it again to expand the sidebar.
*
 Three-Line icon (beside the DASH logo): Hide the sidebar completely. Click it again to reveal the sidebar.
## Topbar
The **topbar** is located at the top of the DASH interface, and gives you access to several Support Center options, useful buttons like **Screenshot** and **Favorite**, and your profile information.
Three-Line icon (beside the DASH logo): Hide the sidebar completely. Click it again to reveal the sidebar.
## Topbar
The **topbar** is located at the top of the DASH interface, and gives you access to several Support Center options, useful buttons like **Screenshot** and **Favorite**, and your profile information.
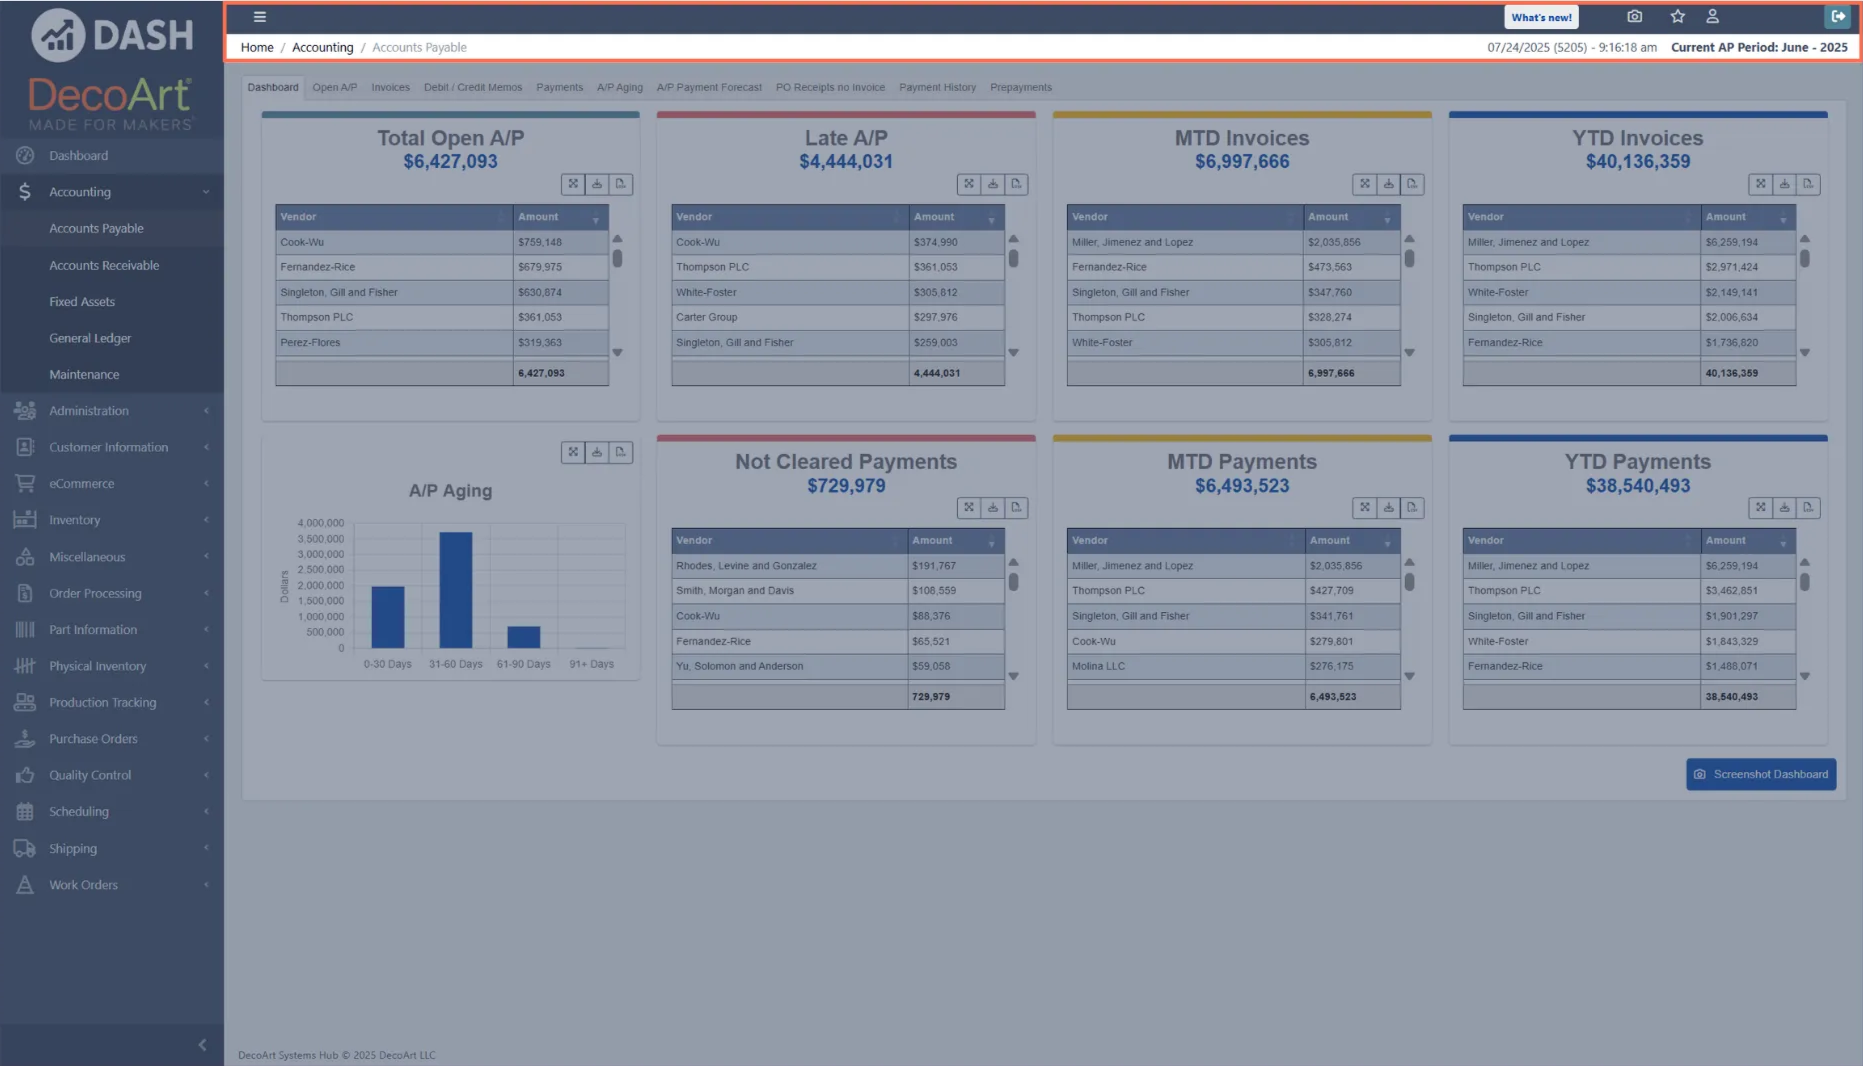 The topbar provides the following options:
*
Three-Line icon: Hide the sidebar completely. Click it again to reveal the sidebar.
* `What’s new!` : Explore new DASH features.
*
The topbar provides the following options:
*
Three-Line icon: Hide the sidebar completely. Click it again to reveal the sidebar.
* `What’s new!` : Explore new DASH features.
*
 Screenshot (Camera) icon: Take a screenshot of your current page and save it to your device.
*
Screenshot (Camera) icon: Take a screenshot of your current page and save it to your device.
*
 Favorite (Star) icon: Add and manage **Favorite** pages, pinning them for quick access. You can add your current page to your Favorites with `Favorite` → `+ Add Current Page`.
*
Favorite (Star) icon: Add and manage **Favorite** pages, pinning them for quick access. You can add your current page to your Favorites with `Favorite` → `+ Add Current Page`.
*
 Profile icon: View and manage your user profile.
*
Profile icon: View and manage your user profile.
*
 Logout icon: Click to securely sign out of DASH.
## Dashboard Interface
Your DASH dashboard contains a customized set of **widgets** showing data from across your DASH modules. They give you a high level view of what’s happening in your company.
Widgets are customized during your DASH setup by DecoArt; your interface may look different than the following example.
Logout icon: Click to securely sign out of DASH.
## Dashboard Interface
Your DASH dashboard contains a customized set of **widgets** showing data from across your DASH modules. They give you a high level view of what’s happening in your company.
Widgets are customized during your DASH setup by DecoArt; your interface may look different than the following example.
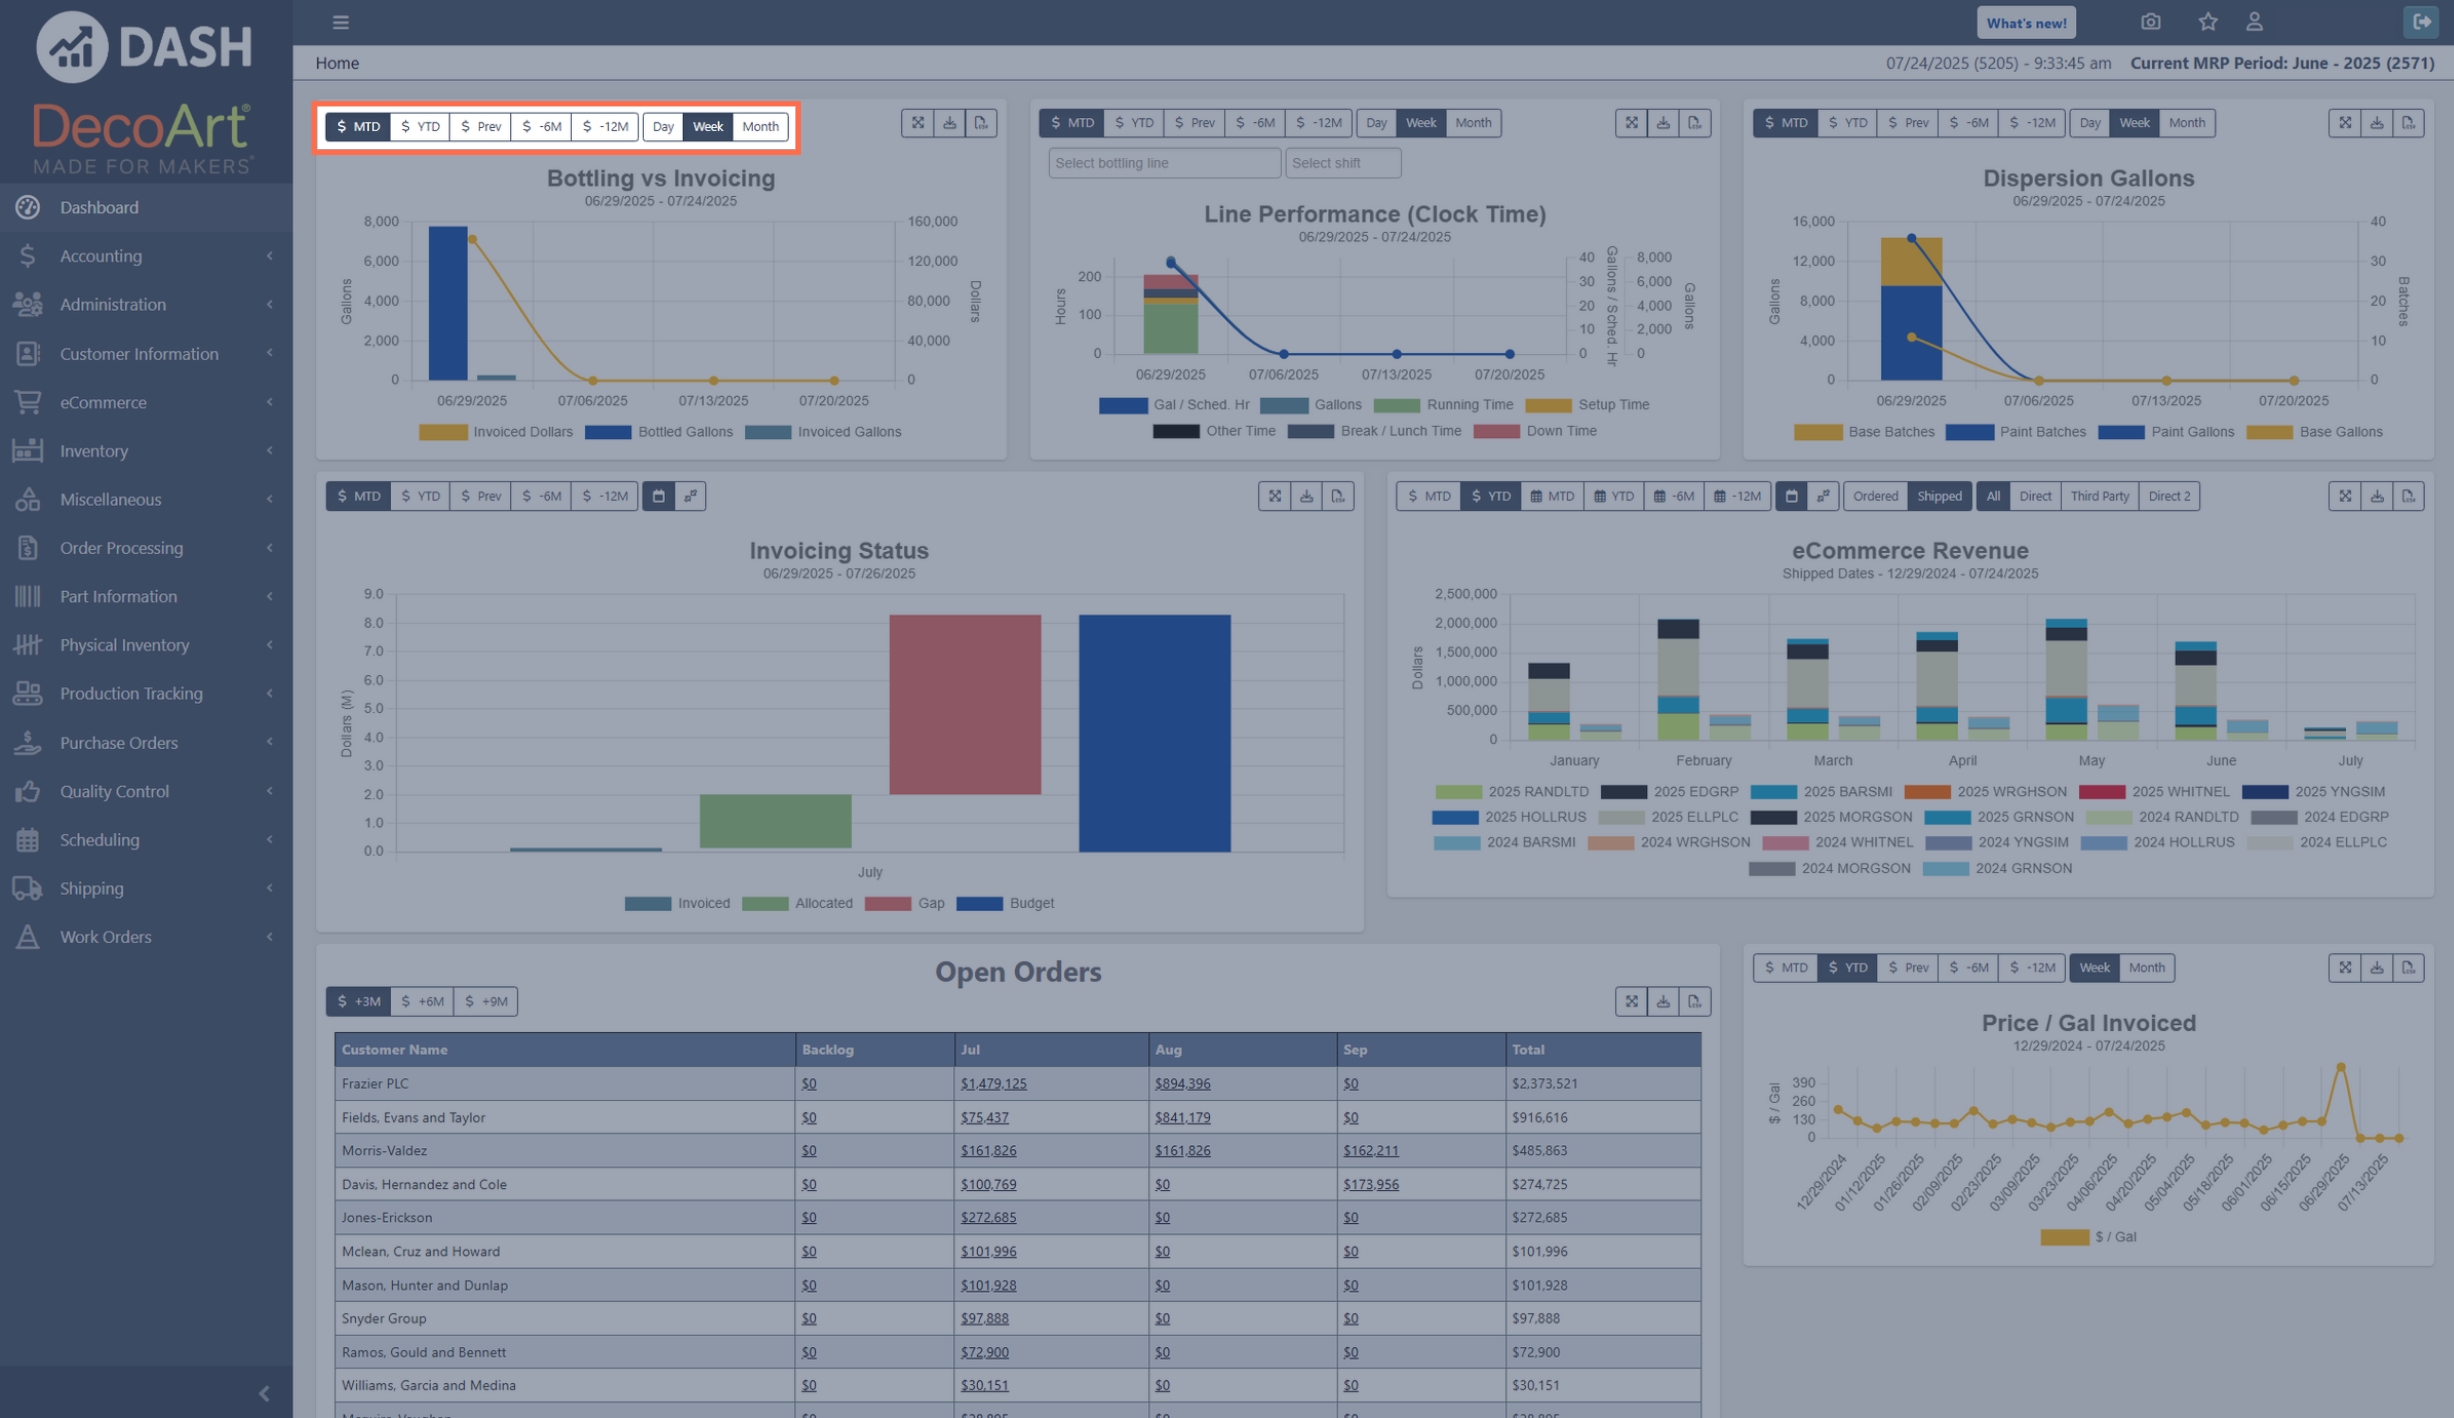 Each Dashboard widget contains a toolbar for viewing, filtering, and downloading the widget’s data. The widget toolbar never allows you to modify the data directly.
The widget toolbar’s specific buttons depend on the widget’s functionality, but in the above example, the highlighted toolbar contains:
Each Dashboard widget contains a toolbar for viewing, filtering, and downloading the widget’s data. The widget toolbar never allows you to modify the data directly.
The widget toolbar’s specific buttons depend on the widget’s functionality, but in the above example, the highlighted toolbar contains:
 * `$ MTD`/`$ YTD`/`$ Prev`/`$ -6M`/`$ -12M`: Filters the data shown to a specific time period, such as:
* Month-to-date (MTD)
* Year-to-date (YTD)
* The previous month (Prev)
* The previous six months (-6M)
* The previous year (-12M)
* `$ MTD`/`$ YTD`/`$ Prev`/`$ -6M`/`$ -12M`: Filters the data shown to a specific time period, such as:
* Month-to-date (MTD)
* Year-to-date (YTD)
* The previous month (Prev)
* The previous six months (-6M)
* The previous year (-12M)
 You may also see these buttons on some widgets:
* The **dollar sign** (\$) icon in front of `MTD` or `YTD` indicates fiscal time periods. For example, clicking on `$ MTD` will filter the data by your **accounting** month-to-date. Fiscal periods could be different between companies and don’t necessarily match up with a calendar month.
* The **calendar** icon shows standard calendar time periods.
* `$ -18M`: Filters the data to the previous 18 months. Because the range spans more than one year, each month label includes its year.
* `$ YTD vs PY`: Shows the current fiscal year-to-date alongside the same period from the previous year, so you can compare this year's invoicing against last year's.
You may also see these buttons on some widgets:
* The **dollar sign** (\$) icon in front of `MTD` or `YTD` indicates fiscal time periods. For example, clicking on `$ MTD` will filter the data by your **accounting** month-to-date. Fiscal periods could be different between companies and don’t necessarily match up with a calendar month.
* The **calendar** icon shows standard calendar time periods.
* `$ -18M`: Filters the data to the previous 18 months. Because the range spans more than one year, each month label includes its year.
* `$ YTD vs PY`: Shows the current fiscal year-to-date alongside the same period from the previous year, so you can compare this year's invoicing against last year's.
 * `Day`/`Week`/`Month`: Groups data shown by day/week/month.
* **Expand** icon: Expands the widget across your Dashboard.
* **Download** icon: Downloads the widget. Chart widgets download as a PNG image of the chart, and table widgets download as an Excel file of the table’s data.
* **CSV** icon: Exports the widget’s data as a CSV file.
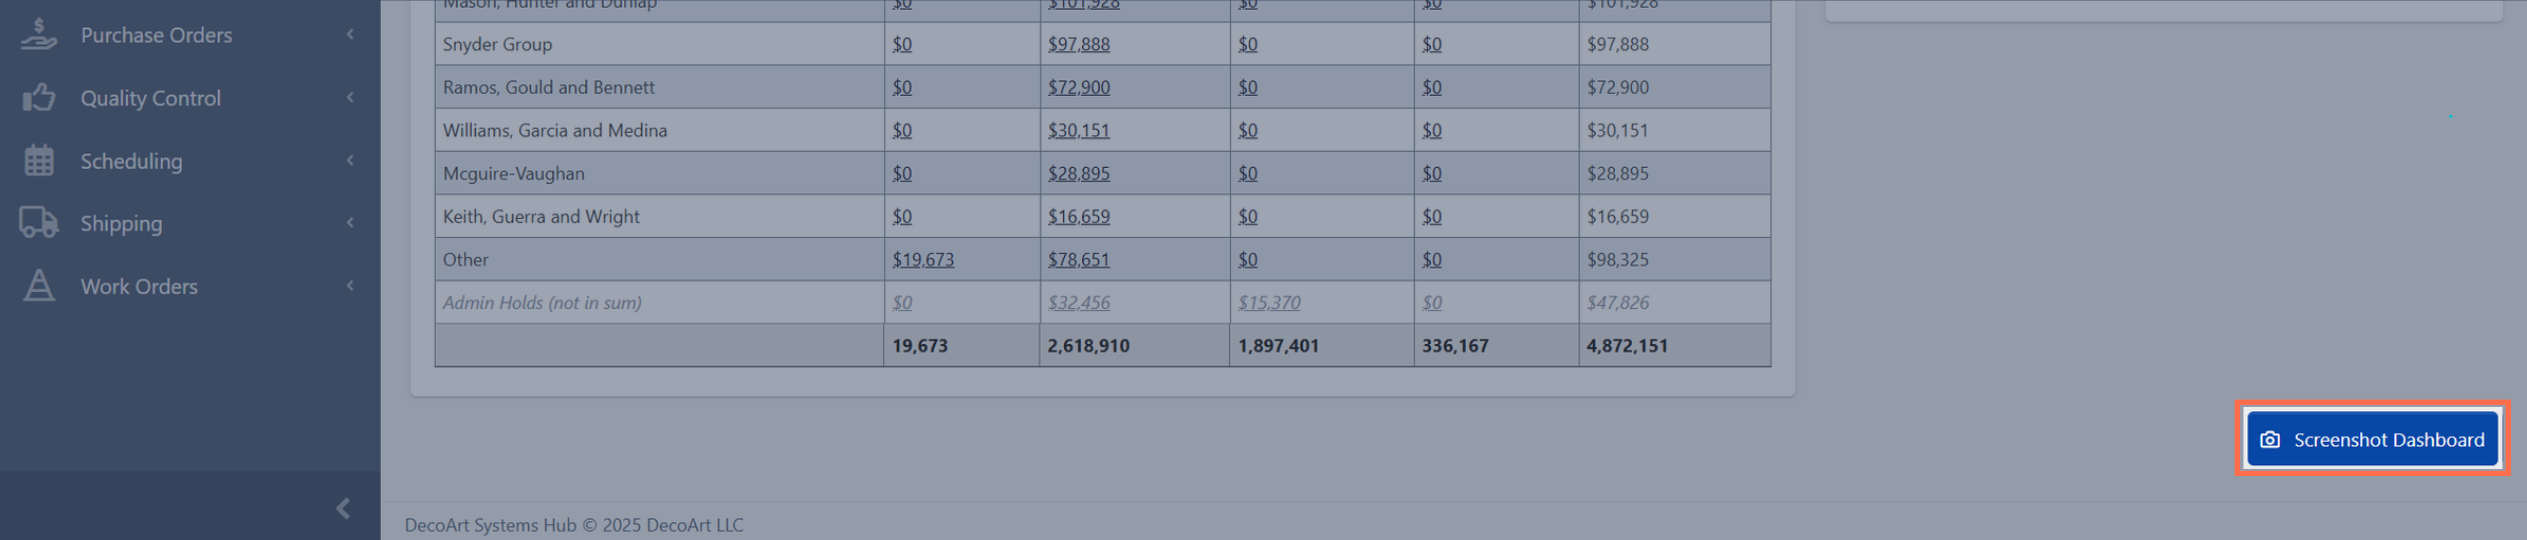
The bottom of the **Dashboard** has a `Screenshot Dashboard` button: Take a screenshot of your Dashboard.
* `Day`/`Week`/`Month`: Groups data shown by day/week/month.
* **Expand** icon: Expands the widget across your Dashboard.
* **Download** icon: Downloads the widget. Chart widgets download as a PNG image of the chart, and table widgets download as an Excel file of the table’s data.
* **CSV** icon: Exports the widget’s data as a CSV file.
The bottom of the **Dashboard** has a `Screenshot Dashboard` button: Take a screenshot of your Dashboard.
 ## Submodule Interface
Each submodule has a custom interface depending on its functionality. You can explore each submodule and its specific interface at: [Overview of DASH Modules](/getting-started/overview-of-dash-modules)
However, many submodules share common interface features. The following example uses the `Accounting` → `Accounts Payable` submodule to explain these features.
### Submodule Tabs
Some submodules contain various **tabs**, located under the topbar. Tabs offer a wide range of functionality within submodules, and can contain submodule dashboards, database views, add/create/manage options, and much more. The tab you’re currently viewing is highlighted. Click on another tab to view that one instead.
## Submodule Interface
Each submodule has a custom interface depending on its functionality. You can explore each submodule and its specific interface at: [Overview of DASH Modules](/getting-started/overview-of-dash-modules)
However, many submodules share common interface features. The following example uses the `Accounting` → `Accounts Payable` submodule to explain these features.
### Submodule Tabs
Some submodules contain various **tabs**, located under the topbar. Tabs offer a wide range of functionality within submodules, and can contain submodule dashboards, database views, add/create/manage options, and much more. The tab you’re currently viewing is highlighted. Click on another tab to view that one instead.
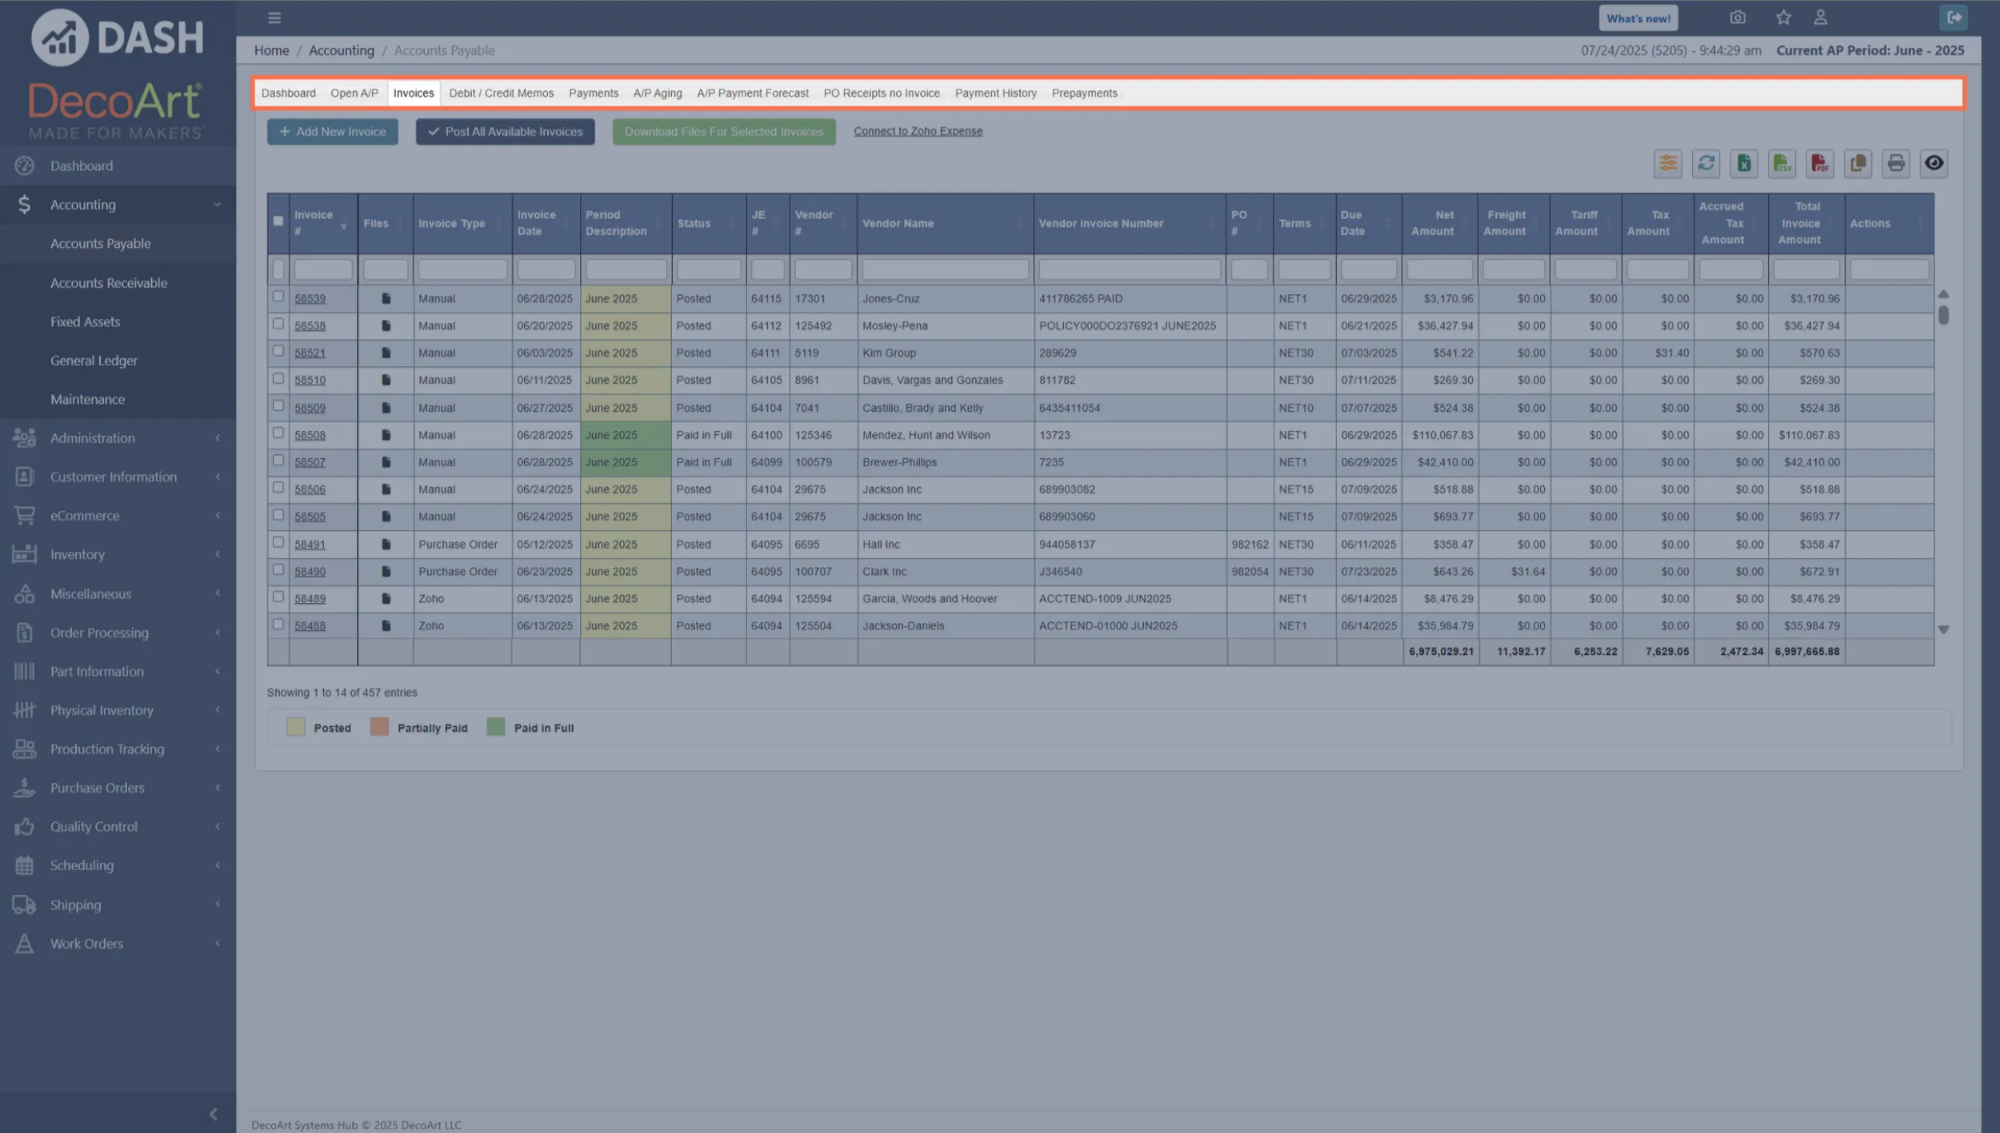 Tabs are interconnected, and changing data on one tab can be reflected in others. In the above `Accounts Payable` example, you can create an Invoice in the `Invoices` tab, then manage payments for that invoice in the `Payments` tab, and view forecasted payments in the `A/P Payment Forecast` tab.
### Submodule Toolbar
Many submodule tabs have a **toolbar** that offers useful functions for completing key tasks.
Tabs are interconnected, and changing data on one tab can be reflected in others. In the above `Accounts Payable` example, you can create an Invoice in the `Invoices` tab, then manage payments for that invoice in the `Payments` tab, and view forecasted payments in the `A/P Payment Forecast` tab.
### Submodule Toolbar
Many submodule tabs have a **toolbar** that offers useful functions for completing key tasks.
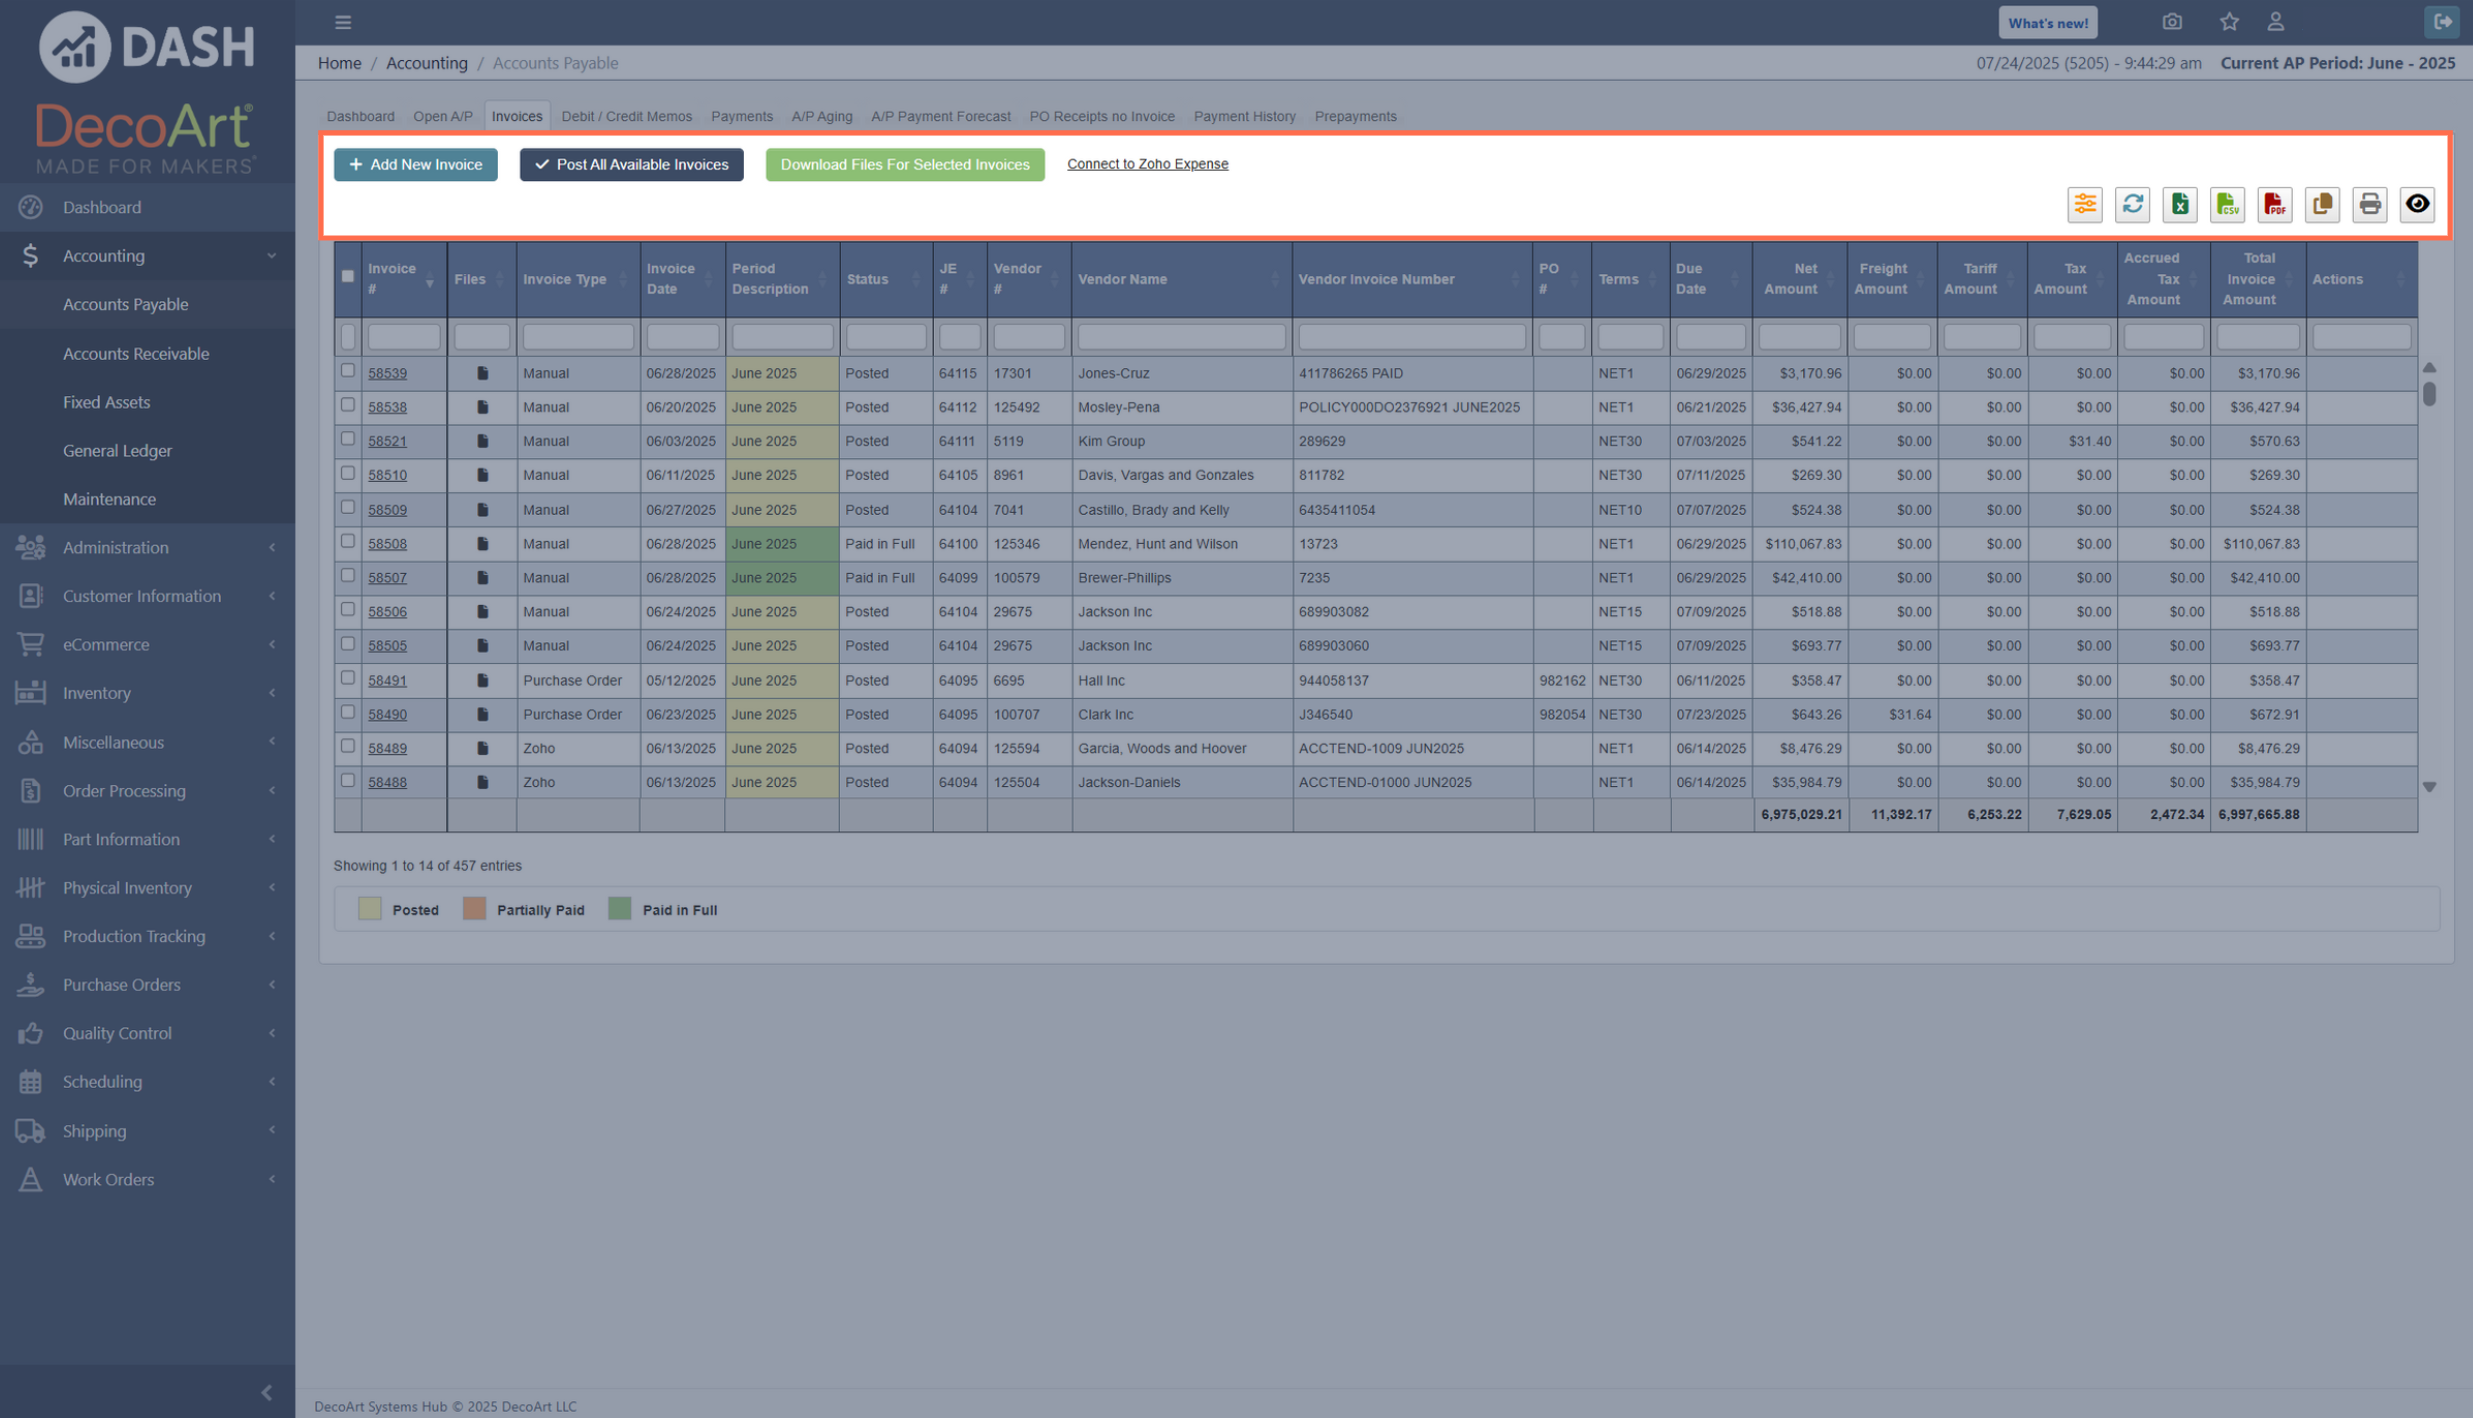 The toolbar is generally divided into **workflow buttons** to the left and **table buttons** to the right.
Workflow buttons change depending on the submodule tab, but in the above example include:
* `+ Add New Invoice`: Create a new invoice.
* `Post All Available Invoices`: Post available invoices to the ledger.
* `Download Files for Selected Invoice`: Download all content associated with a chosen invoice.
* `Connect to Zoho Expense`: Sign into your Zoho account to integrate it with DASH.
Table buttons appear in submodule tabs with tables, and allow you to view or download the associated data. Hover your cursor over the buttons to see their names. The buttons are:
The toolbar is generally divided into **workflow buttons** to the left and **table buttons** to the right.
Workflow buttons change depending on the submodule tab, but in the above example include:
* `+ Add New Invoice`: Create a new invoice.
* `Post All Available Invoices`: Post available invoices to the ledger.
* `Download Files for Selected Invoice`: Download all content associated with a chosen invoice.
* `Connect to Zoho Expense`: Sign into your Zoho account to integrate it with DASH.
Table buttons appear in submodule tabs with tables, and allow you to view or download the associated data. Hover your cursor over the buttons to see their names. The buttons are:
 * `Refresh`: Refreshes the table’s data, which is useful if the data seems out of date.
* `Export to Excel`: Exports and downloads the table’s data in Excel format.
* `Export to CSV`: Exports and downloads the table’s data in CSV format.
* `Export to PDF`: Exports and downloads the table’s data in PDF format.
* `Copy to Clipboard`: Copy the table’s data to your clipboard.
* `Print`: Prints the current table view.
* `Show/Hide Columns` (Eye icon): Toggle which table columns you can view and hide.
**Learn more about navigating tables in Table Interface below.**
### Submodule Content
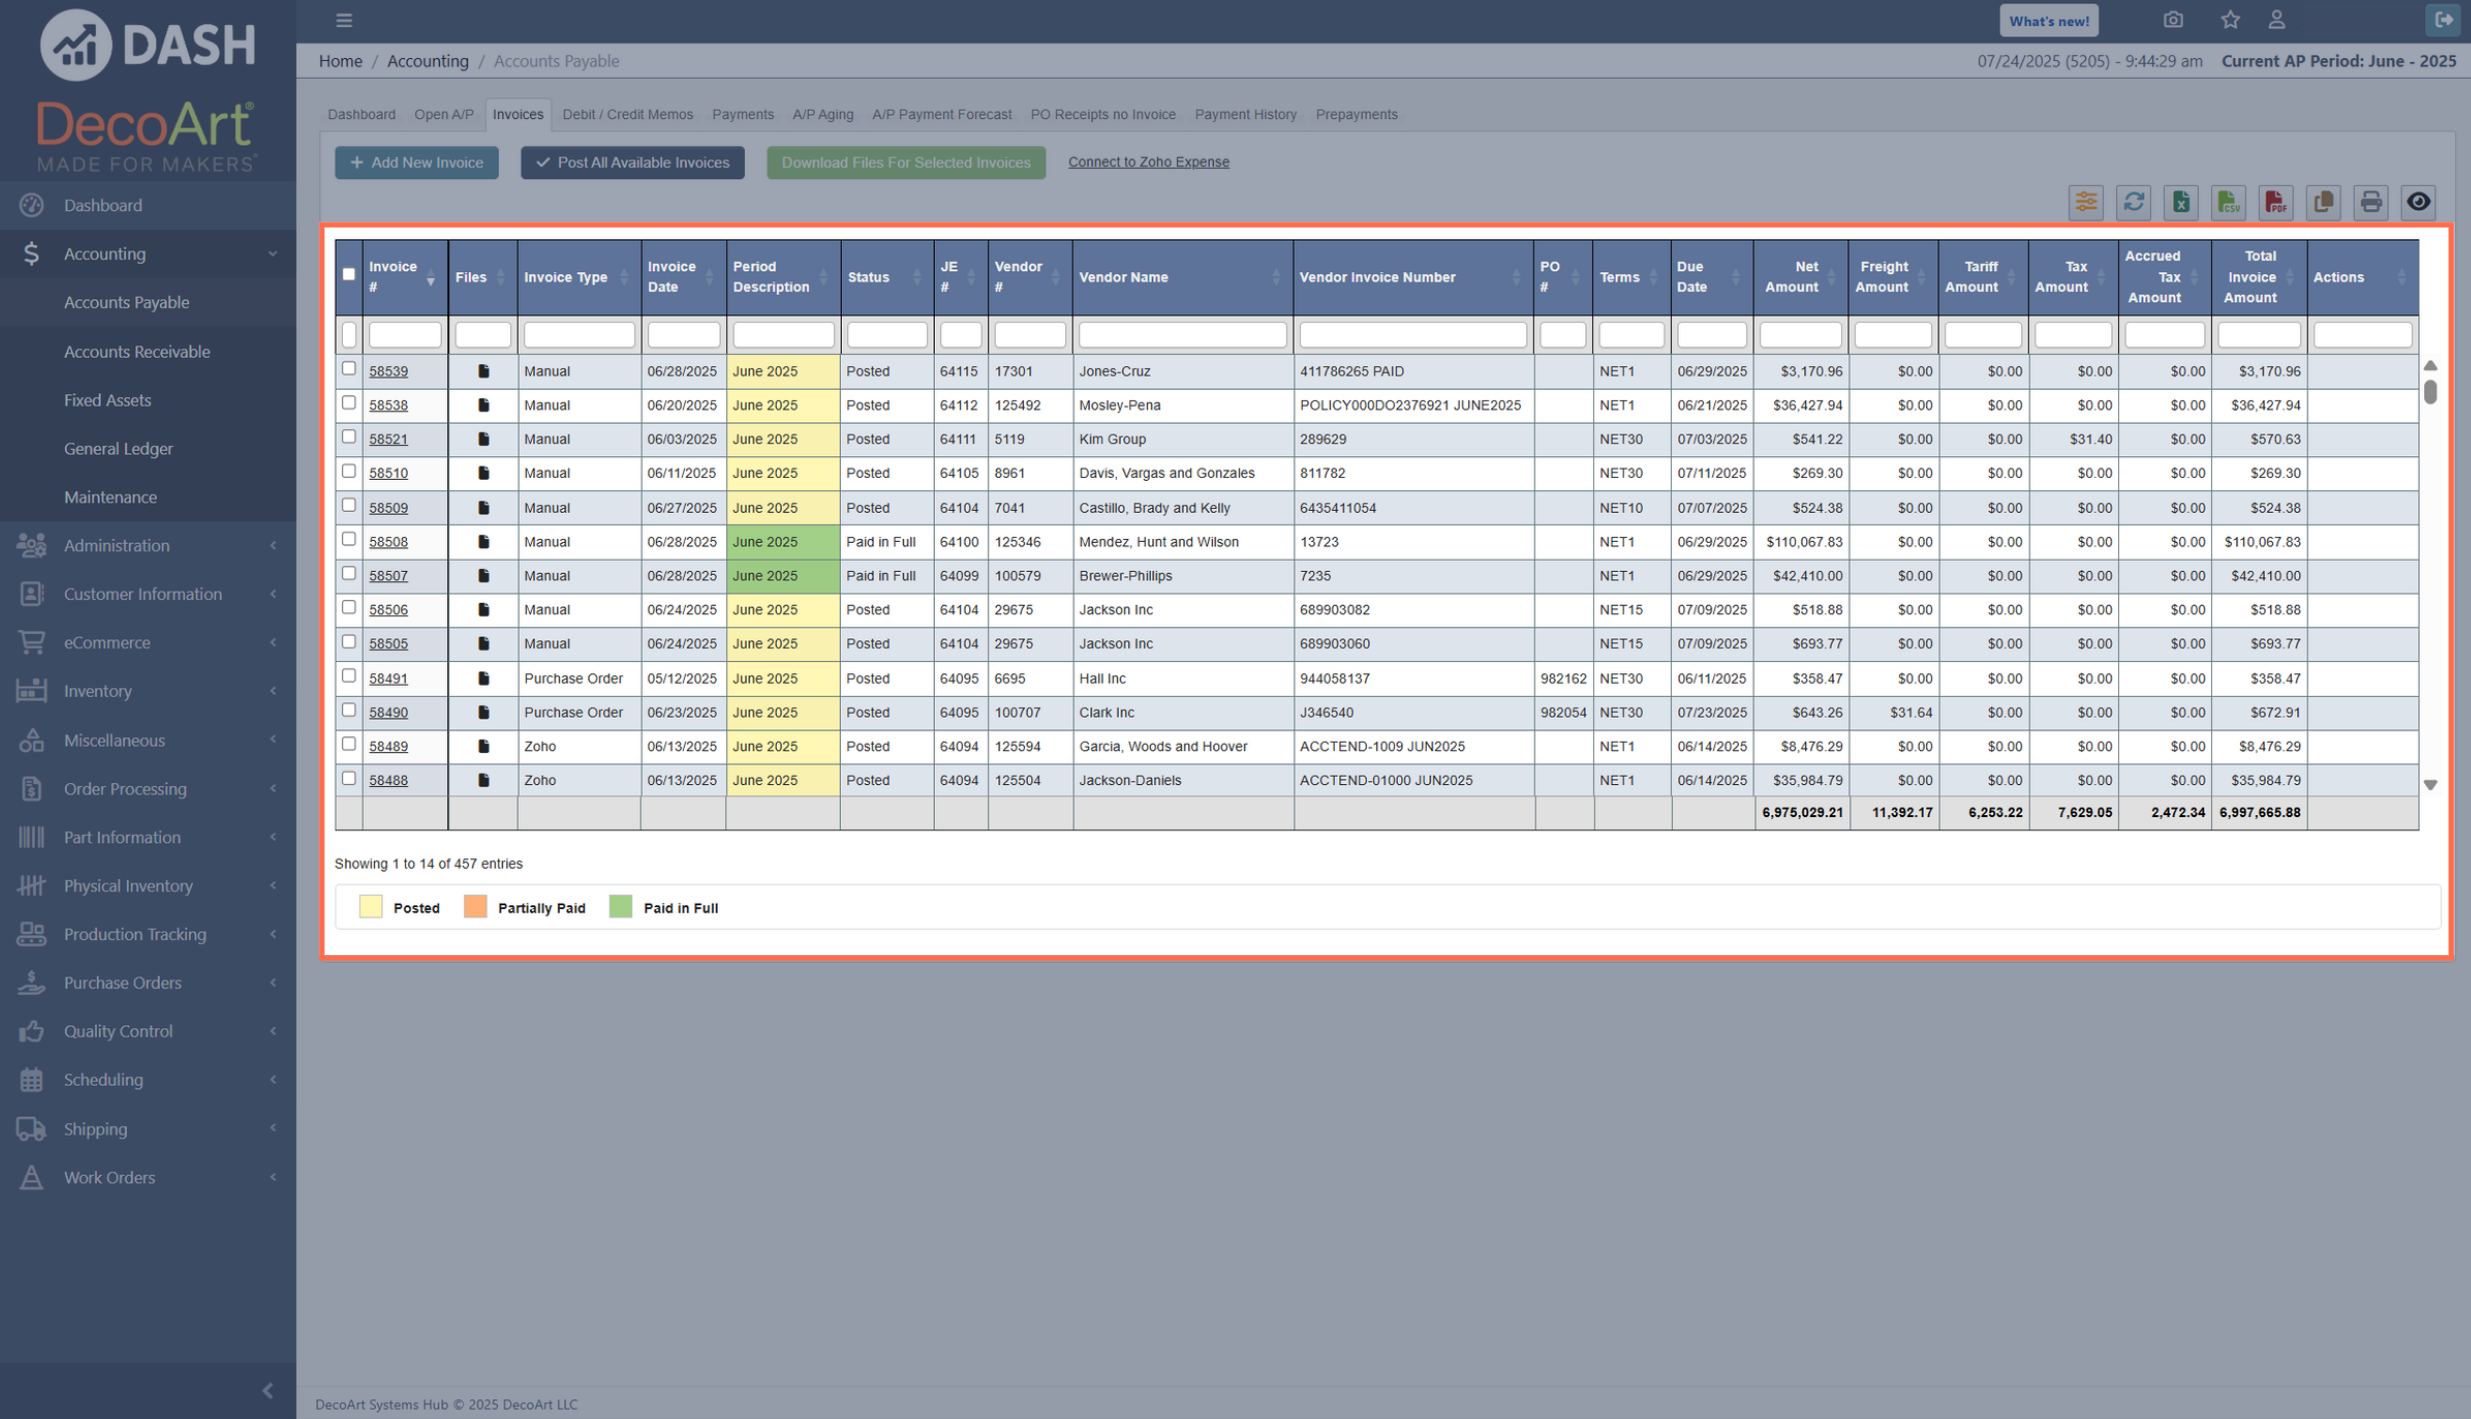
Each submodule contains **content** in the center of the page, which can include:
* Table views, allowing you to view, manage, and download specific data.
* Information input pages, allowing you to create/add/manage discrete items, such as Invoices, Parts, Work Orders, and more.
* Submodule dashboards, showing you a high level view of your submodule data.
* `Refresh`: Refreshes the table’s data, which is useful if the data seems out of date.
* `Export to Excel`: Exports and downloads the table’s data in Excel format.
* `Export to CSV`: Exports and downloads the table’s data in CSV format.
* `Export to PDF`: Exports and downloads the table’s data in PDF format.
* `Copy to Clipboard`: Copy the table’s data to your clipboard.
* `Print`: Prints the current table view.
* `Show/Hide Columns` (Eye icon): Toggle which table columns you can view and hide.
**Learn more about navigating tables in Table Interface below.**
### Submodule Content
Each submodule contains **content** in the center of the page, which can include:
* Table views, allowing you to view, manage, and download specific data.
* Information input pages, allowing you to create/add/manage discrete items, such as Invoices, Parts, Work Orders, and more.
* Submodule dashboards, showing you a high level view of your submodule data.
 ## Table Interface
You’ll also see many tables across different submodules.
## Table Interface
You’ll also see many tables across different submodules.
 While features vary by context, most tables support the following:
* **Sorting:** Click a column header to sort.
* **Multiple column sorting:** Hold `Shift` and click several column headers.
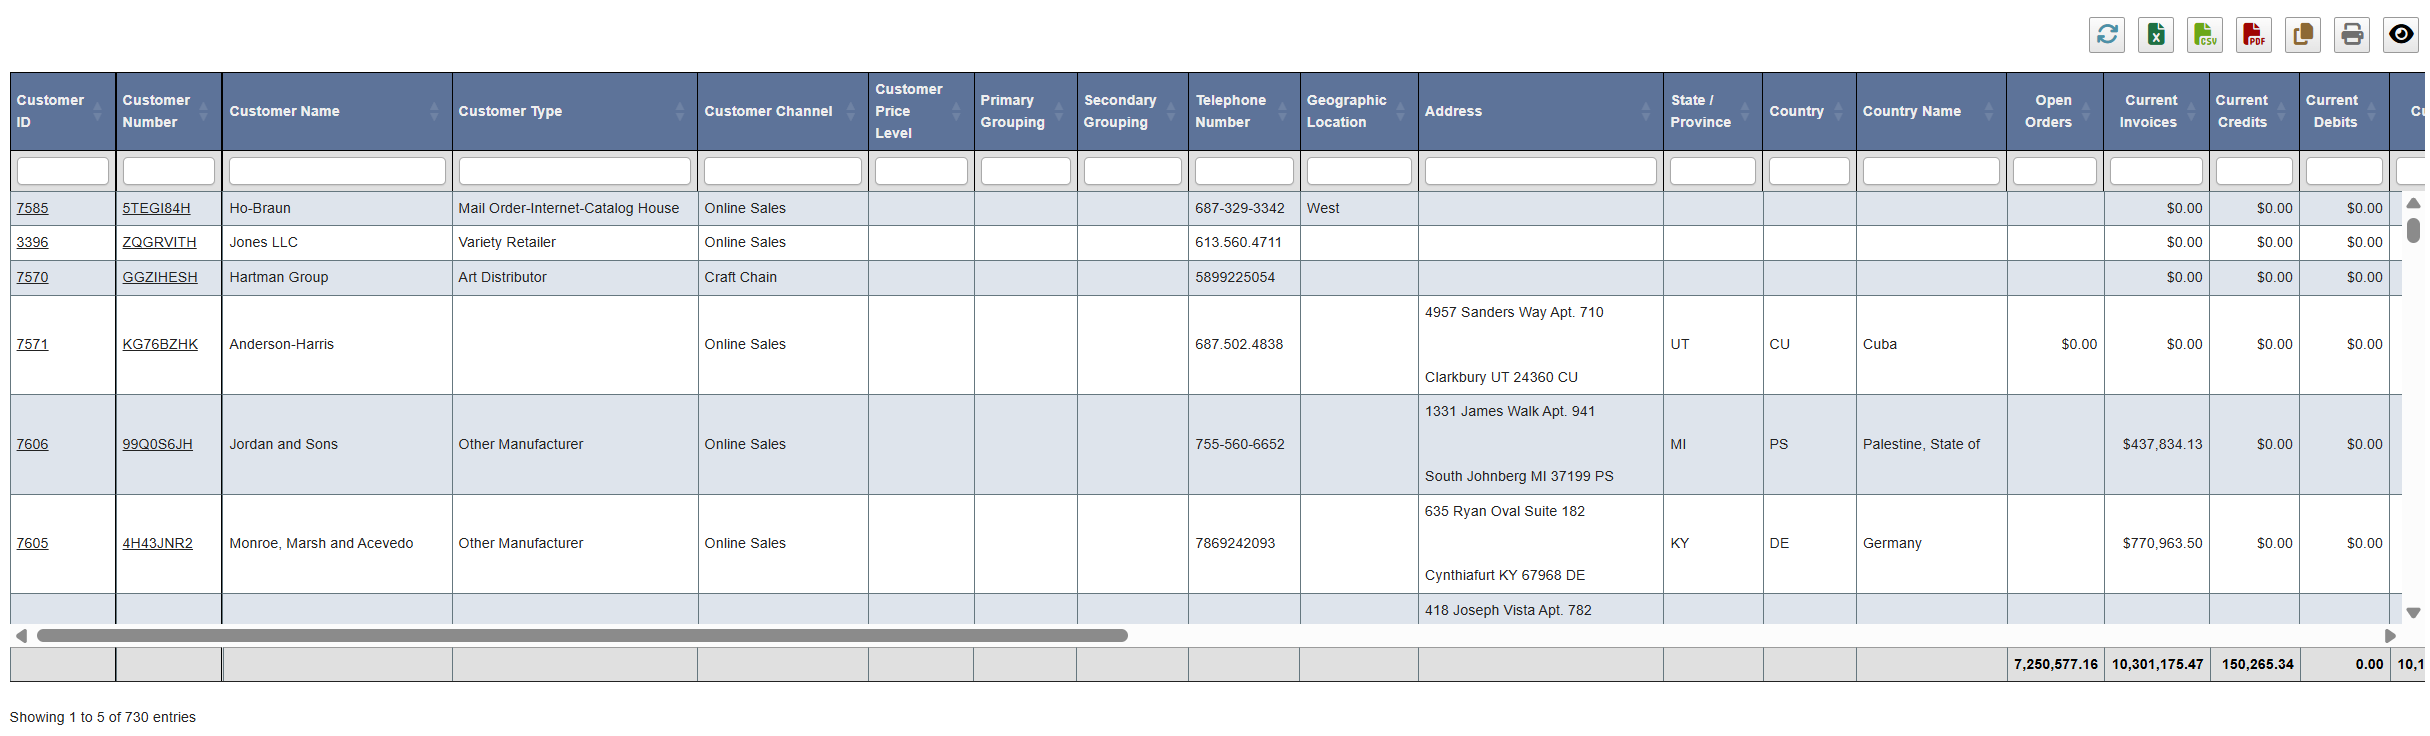
* Shift-clicking shows multiple sort arrows across columns. Clicking without Shift returns to sorting by one column.
While features vary by context, most tables support the following:
* **Sorting:** Click a column header to sort.
* **Multiple column sorting:** Hold `Shift` and click several column headers.
* Shift-clicking shows multiple sort arrows across columns. Clicking without Shift returns to sorting by one column.
 The screenshot shows an example of **Multiple column sorting**, with 3 columns’ arrows lighting up.
If you’re sorting by one column, only that column’s arrow will light up.
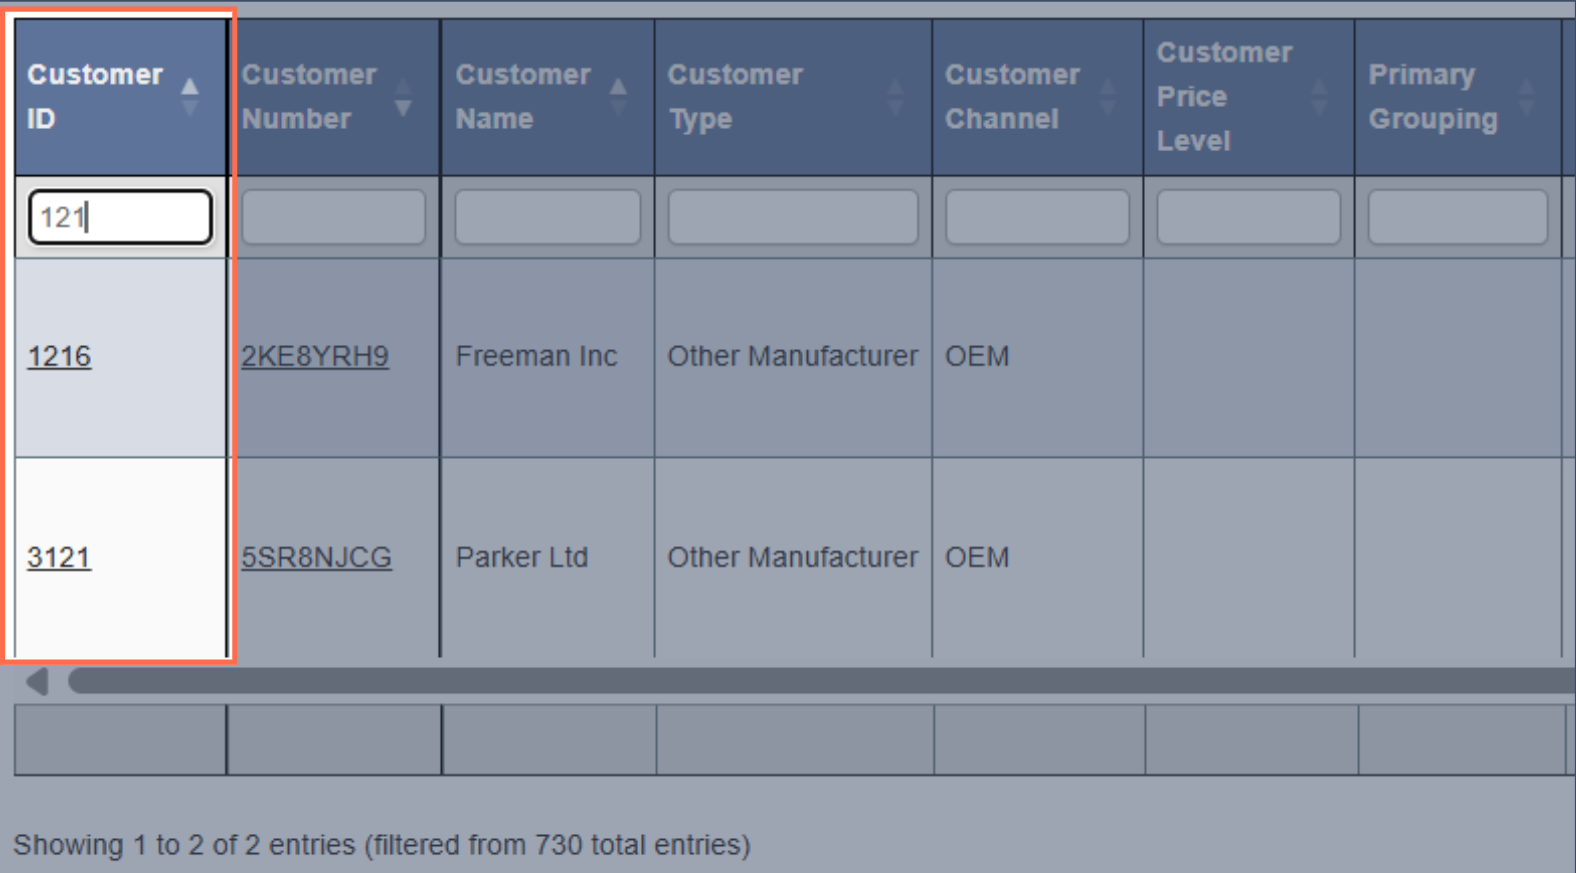
* **Searching:** Type in the empty fields under column headers to filter your results (e.g., typing “121” under Customer ID would show you all customer IDs that include “121”).
The screenshot shows an example of **Multiple column sorting**, with 3 columns’ arrows lighting up.
If you’re sorting by one column, only that column’s arrow will light up.
* **Searching:** Type in the empty fields under column headers to filter your results (e.g., typing “121” under Customer ID would show you all customer IDs that include “121”).
 * **Saved States:** Many tables include a `Saved State` button in the upper-right toolbar. Use it to save table views you want to return to later.
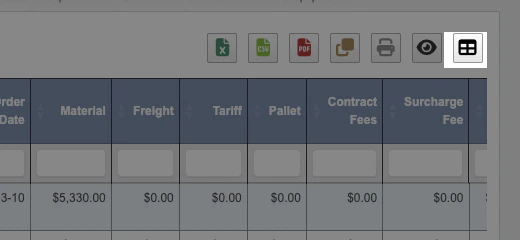 You can use saved states to keep common table setups for later, such as a preferred sorting layout, visible columns, page length, and other table view choices.
**How to use saved states**
1. Set up the table the way you want it.
2. Click the `Saved State` button.
3. Click `Create State` to save the current table view.
4. Click a saved state name later to switch the table back to that saved view.
5. Click the arrow beside a saved state to manage it.
If you do not select a saved state, the table stays on its default configuration.
You can use saved states to keep common table setups for later, such as a preferred sorting layout, visible columns, page length, and other table view choices.
**How to use saved states**
1. Set up the table the way you want it.
2. Click the `Saved State` button.
3. Click `Create State` to save the current table view.
4. Click a saved state name later to switch the table back to that saved view.
5. Click the arrow beside a saved state to manage it.
If you do not select a saved state, the table stays on its default configuration.
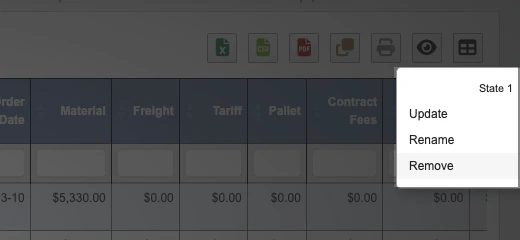
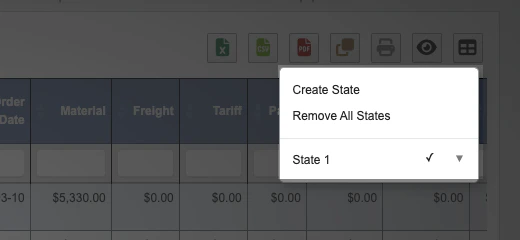 From the saved state's action menu, you can:
* `Update`: Save your current table setup into that existing state.
* `Rename`: Change the saved state's name.
* `Remove`: Delete that one saved state.
* `Remove All States`: Delete every saved state for that table.
From the saved state's action menu, you can:
* `Update`: Save your current table setup into that existing state.
* `Rename`: Change the saved state's name.
* `Remove`: Delete that one saved state.
* `Remove All States`: Delete every saved state for that table.
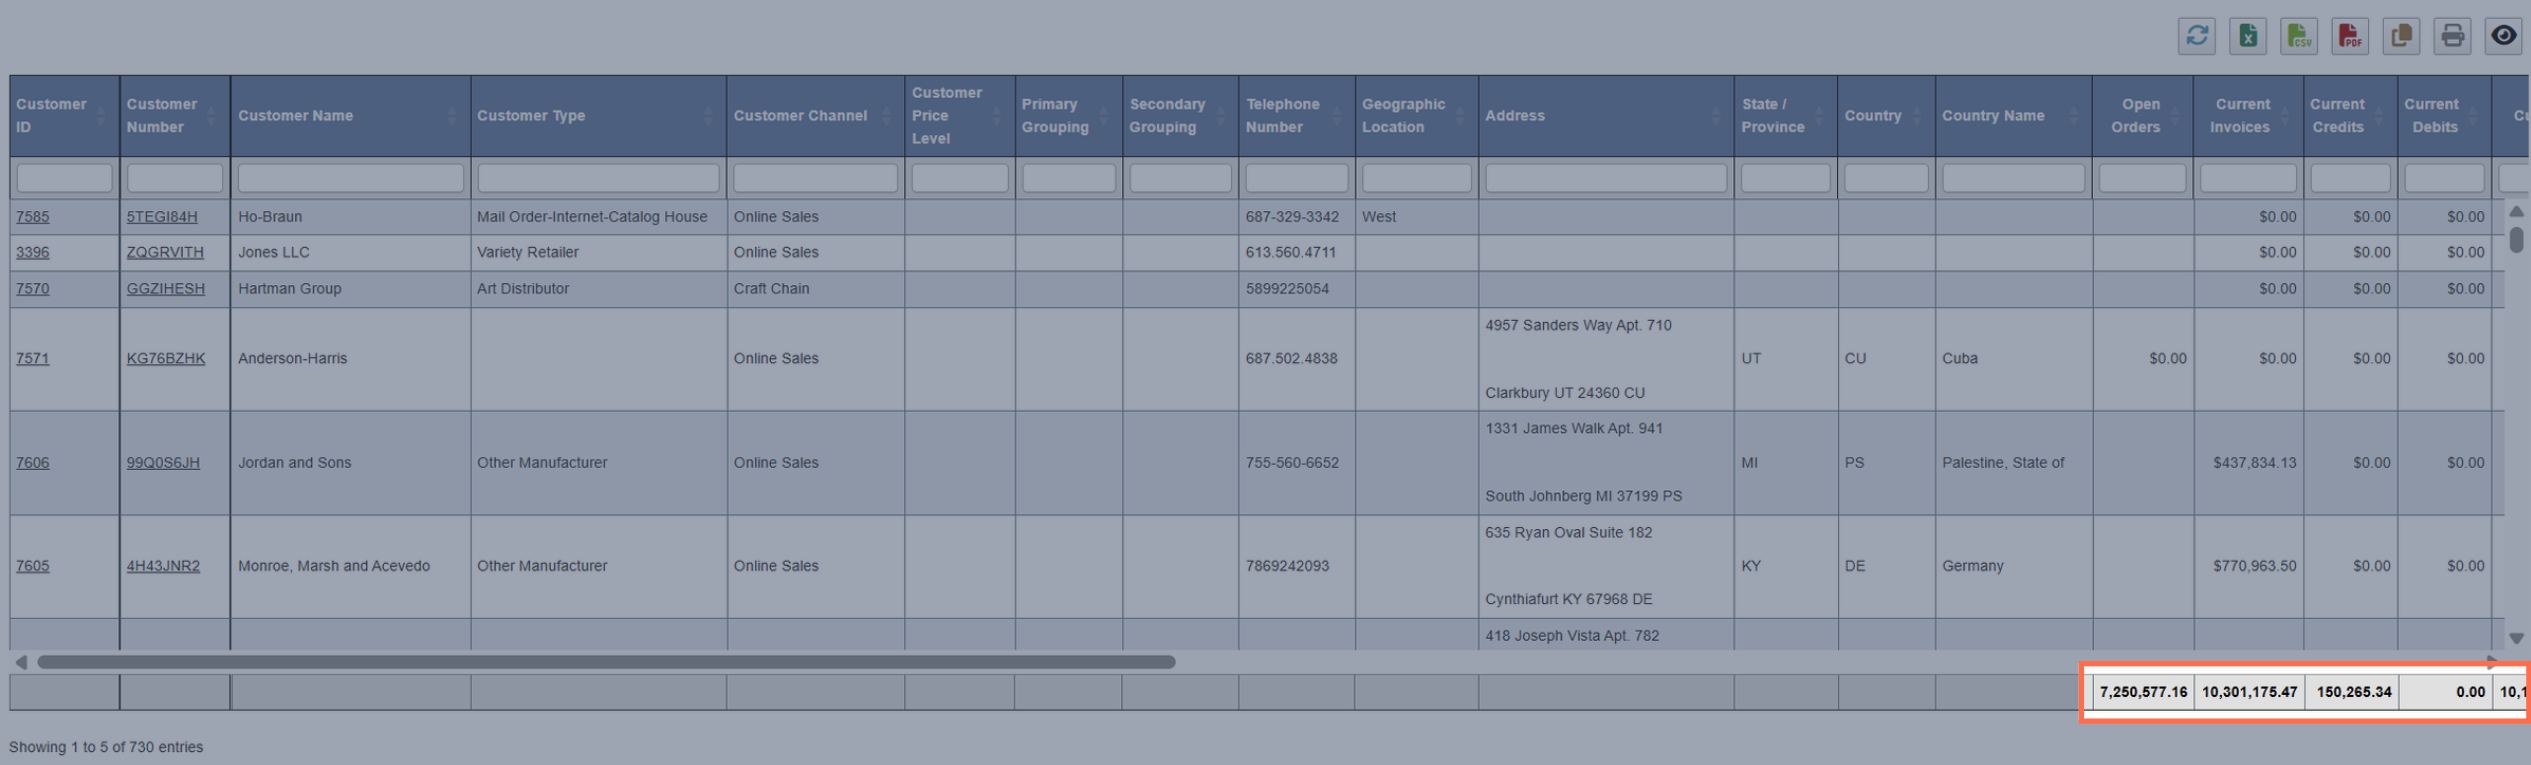
 * **Summation Rows**: Numeric columns often include totals at the bottom of the table.
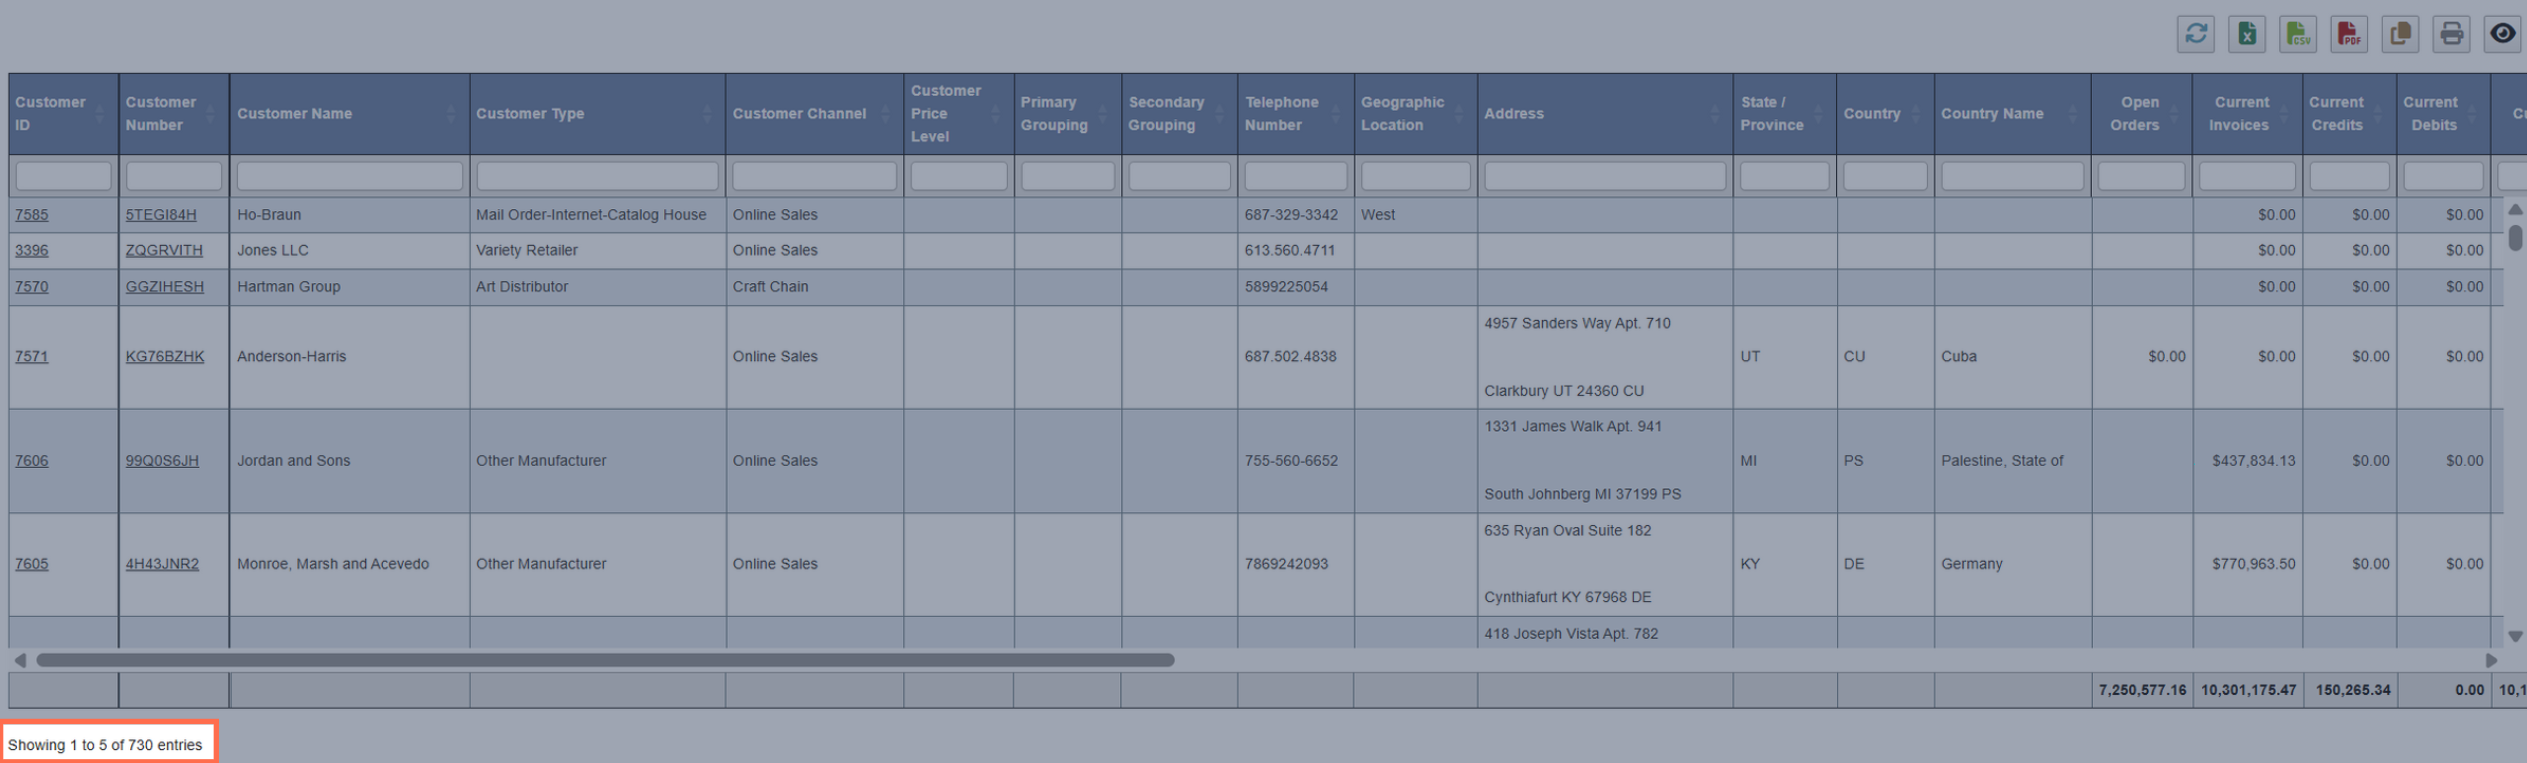
 * **Result Count**: Bottom-left corner shows the number of results and which ones you’re viewing (e.g., 39 of 457 entries).
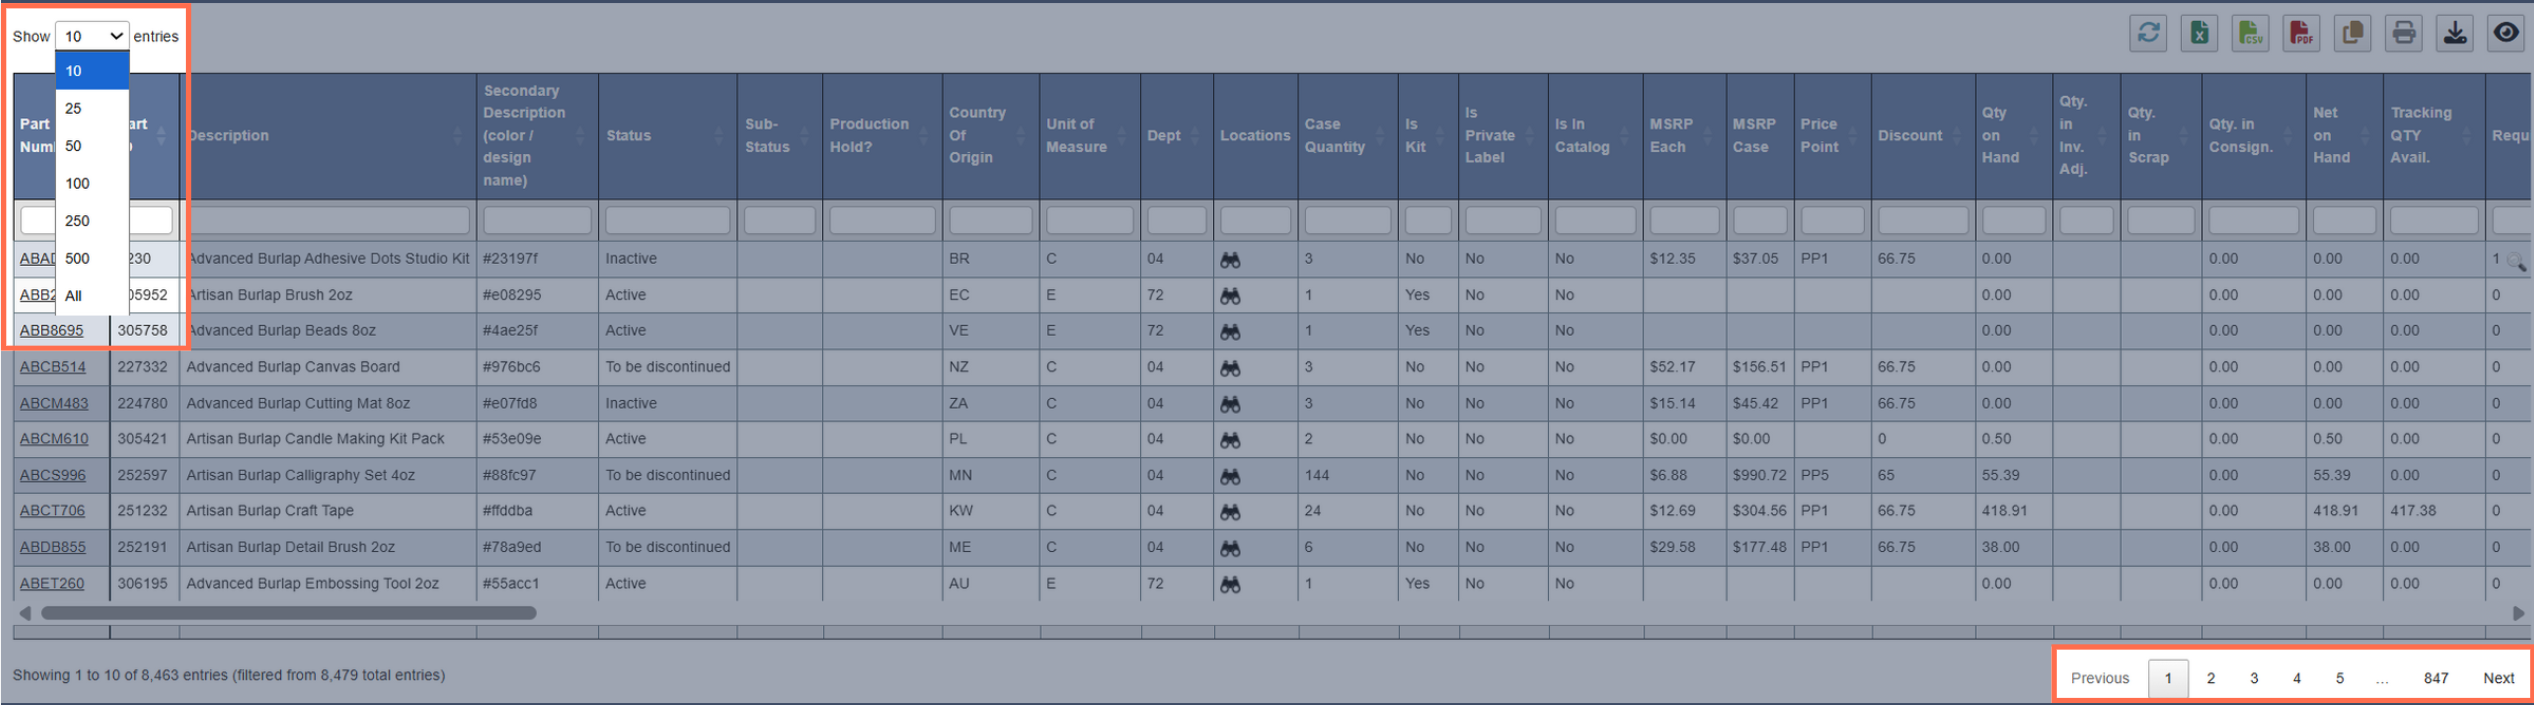
 * **Pagination**: Large datasets (like Finished Goods) load in batches of 10 by default for performance.
* You can use the page selector at the bottom to navigate to the next pages, or the last page.
* You can also choose to load in batches of 25, 50, 100, or show all items.
* **Pagination**: Large datasets (like Finished Goods) load in batches of 10 by default for performance.
* You can use the page selector at the bottom to navigate to the next pages, or the last page.
* You can also choose to load in batches of 25, 50, 100, or show all items.
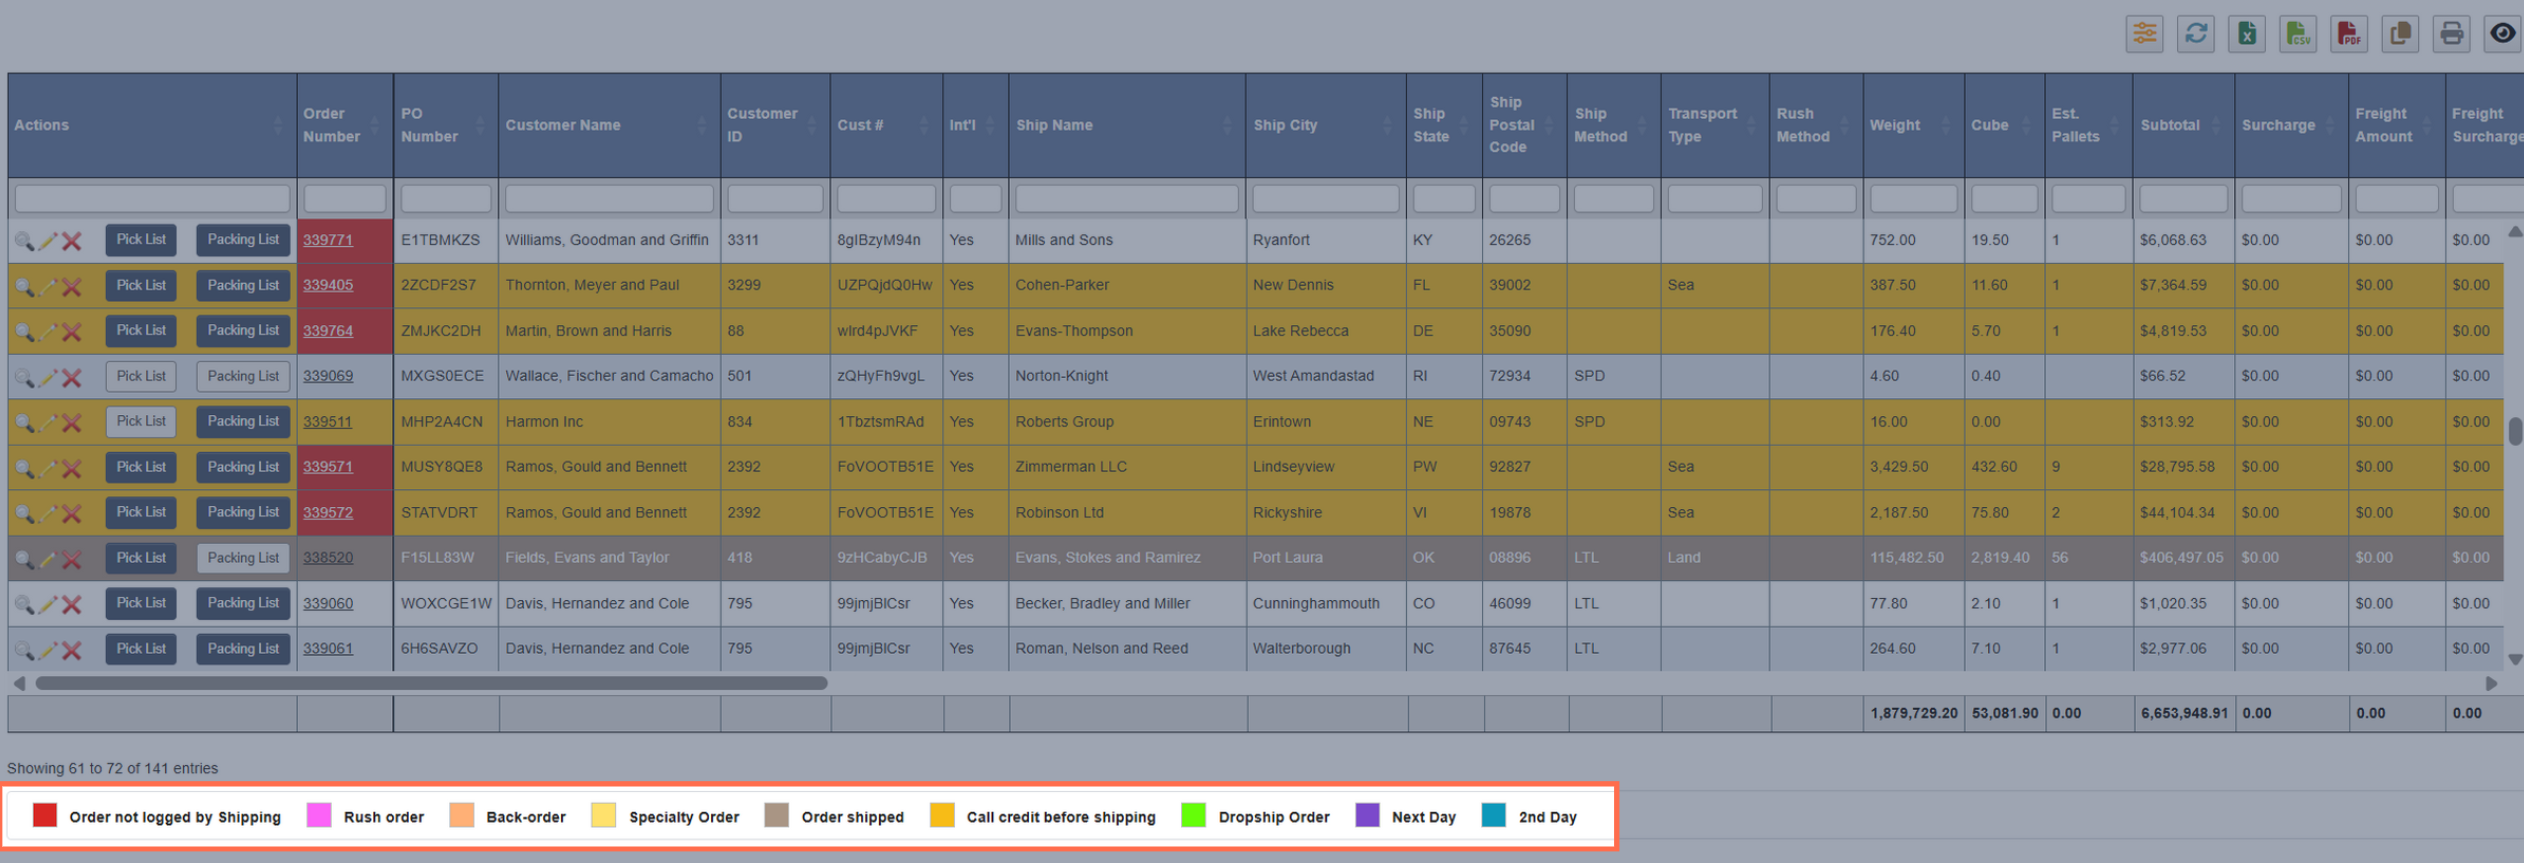
 * **Color Legend:** Some tables use color coding (e.g., open orders) for items. You can find a legend at the bottom to explain the colors.
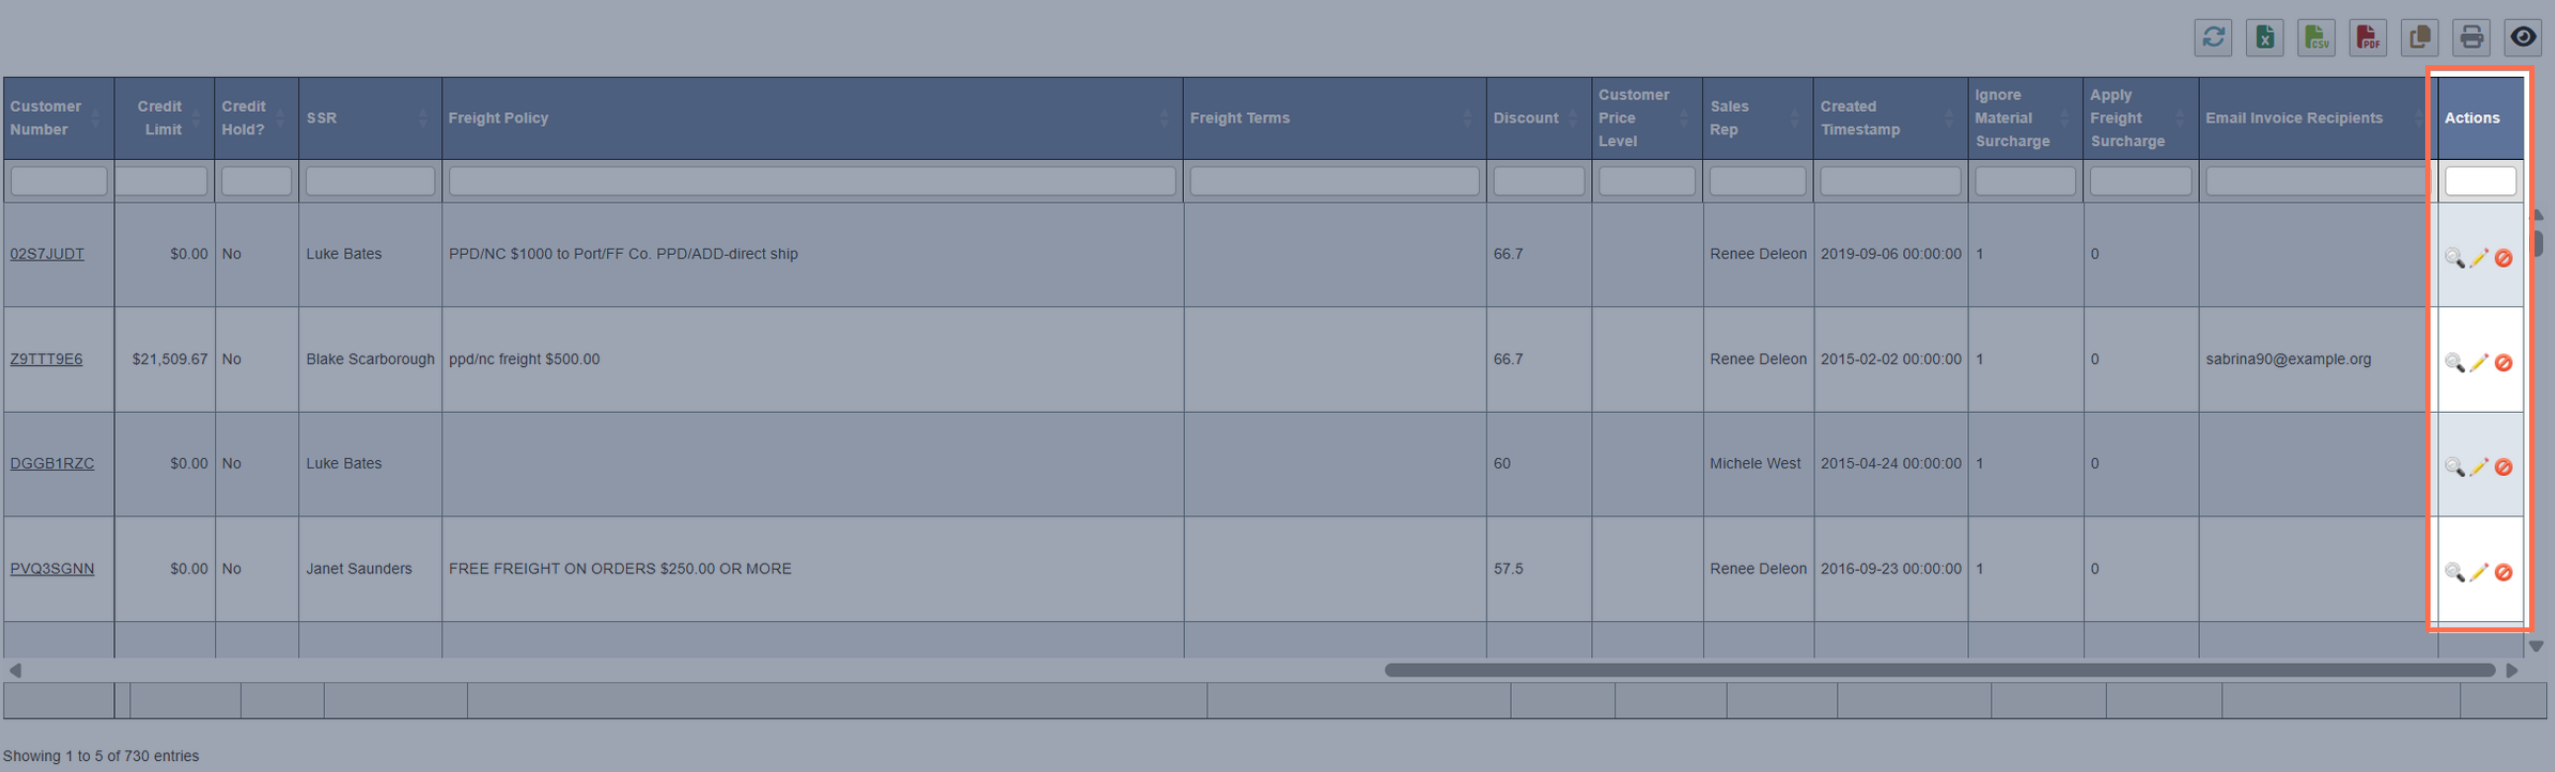
 * **Action Column:** Buttons for row-specific actions (edit, delete, activate, deactive, etc.) appear either in the first or last column.
 ## Next Steps
* Explore each DASH module from the [Overview of DASH Modules page](/getting-started/overview-of-dash-modules).
## Next Steps
* Explore each DASH module from the [Overview of DASH Modules page](/getting-started/overview-of-dash-modules).