> ## Documentation Index
> Fetch the complete documentation index at: https://docs.decoart.com/llms.txt
> Use this file to discover all available pages before exploring further.
# Loss of Sales Submodule
## Overview
The **Order Processing → Loss of Sales** submodule shows where and why revenue was lost when orders couldn’t be fulfilled.
Accounting, operations, and purchasing teams use it to see missed or unfilled orders, spot trends, and measure the impact by cause, customer, material, and vendor.
## What You Can Do
### Dashboard (analysis & trends)
Use the Dashboard to review losses at a glance and drill into patterns. On most widgets, you can filter the data by time period:
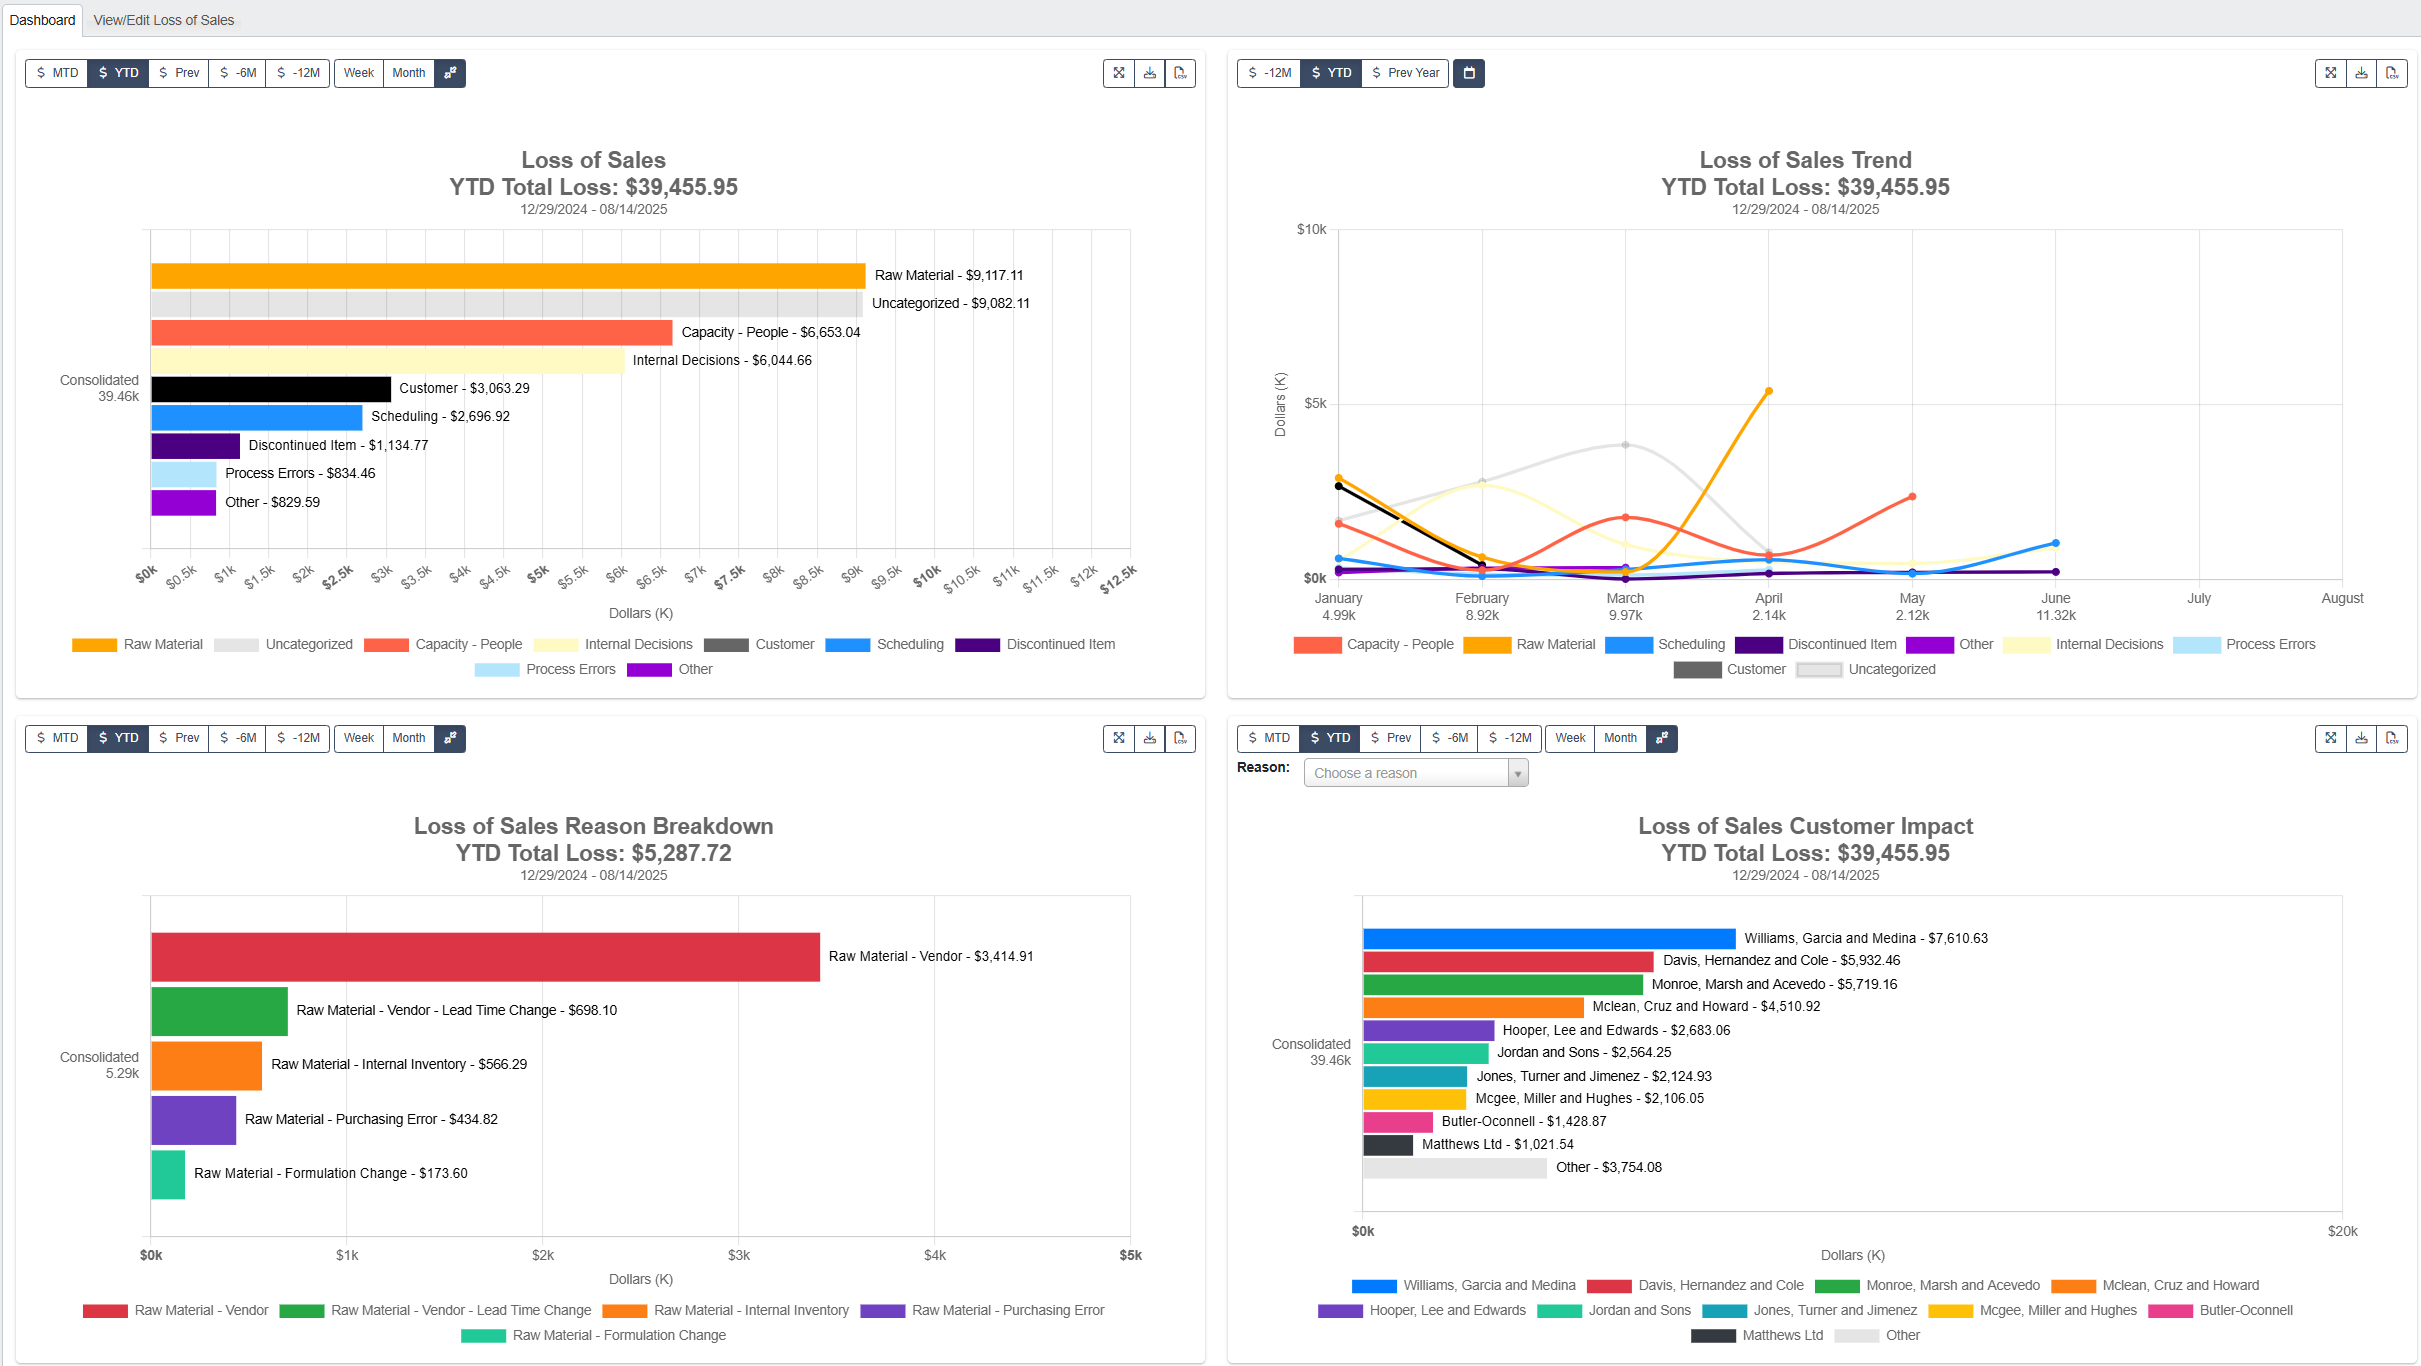 The example below shows how the same charts appear with different time unit filters applied: `month` for **Loss of Sales** and `week` for **Loss of Sales Reason Breakdown**.
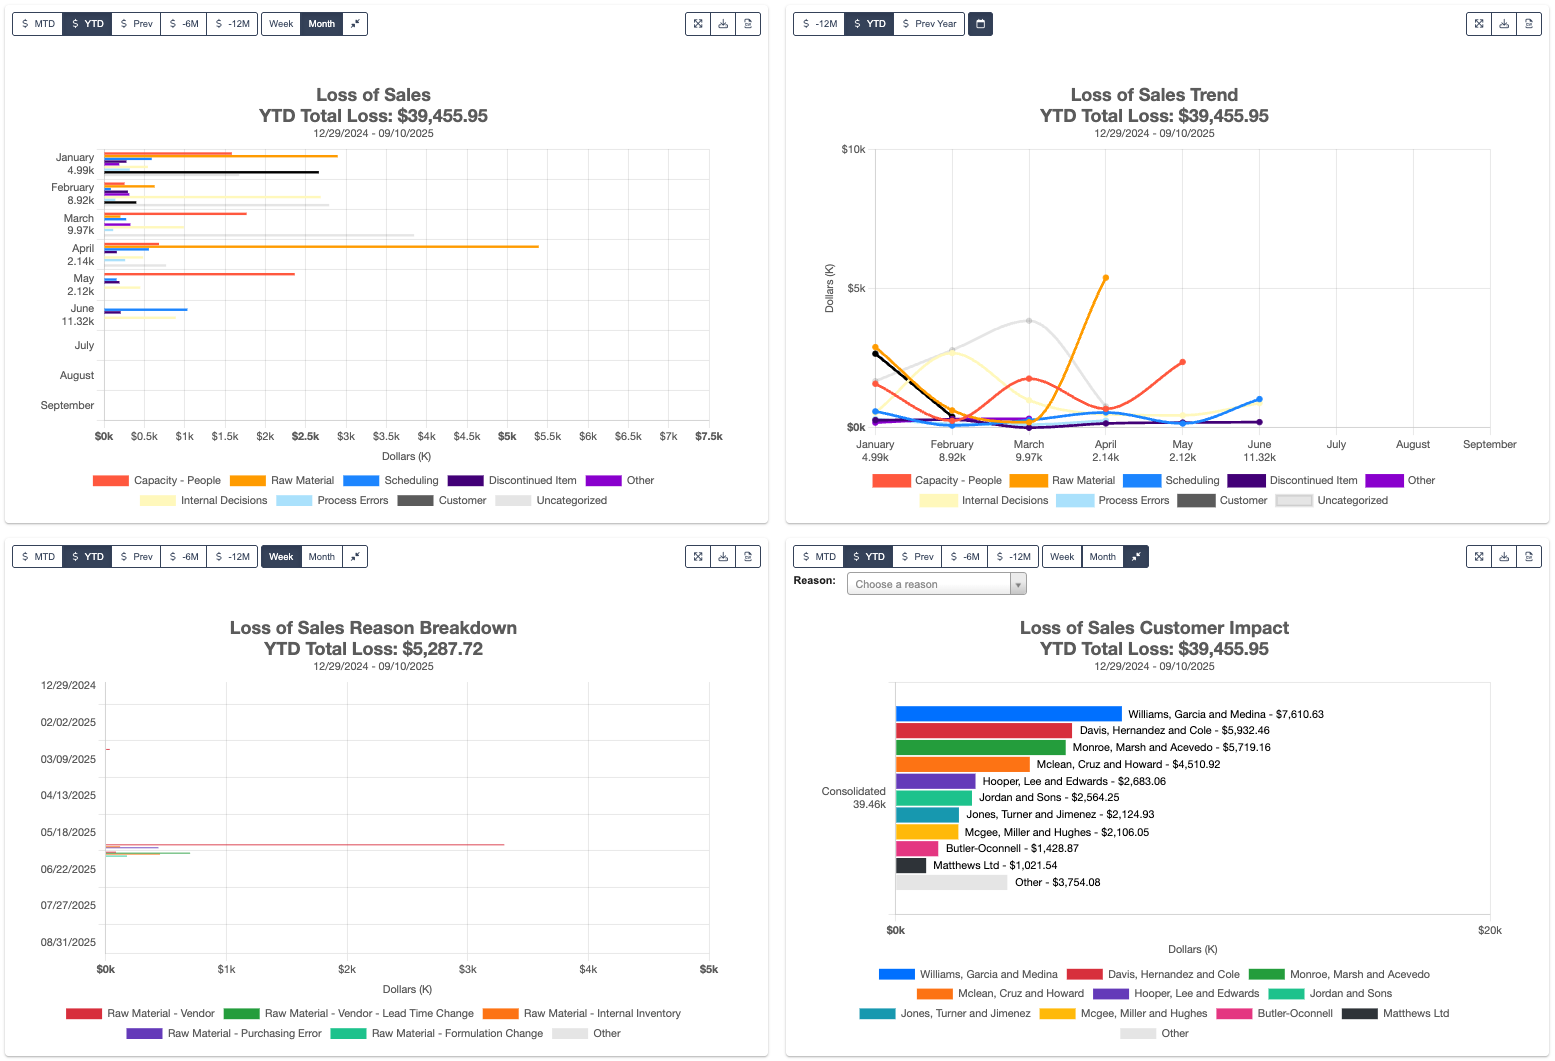 All timeframe options here use **fiscal** periods (shown with the **dollar sign** `$` icon). Fiscal periods may differ from calendar months and years, depending on your company’s accounting setup.
#### **Filter options** (availability varies by widget):
**Time period filter**:
All timeframe options here use **fiscal** periods (shown with the **dollar sign** `$` icon). Fiscal periods may differ from calendar months and years, depending on your company’s accounting setup.
#### **Filter options** (availability varies by widget):
**Time period filter**:
 * `MTD` - month-to-date
* `YTD` - year-to-date
* `Prev` - the previous fiscal period
* `6M` - last 6 months
* `12M` - last 12 months
* `Prev Year` - the previous year
**Time unit filter**:
* `MTD` - month-to-date
* `YTD` - year-to-date
* `Prev` - the previous fiscal period
* `6M` - last 6 months
* `12M` - last 12 months
* `Prev Year` - the previous year
**Time unit filter**:
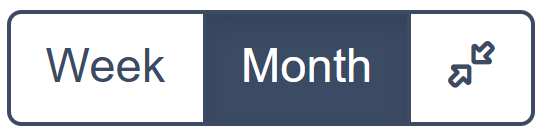 * `Week` - view data week-by-week
* `Month` - view data month-by-month
**Additional navigation options**:
* `Week` - view data week-by-week
* `Month` - view data month-by-month
**Additional navigation options**:
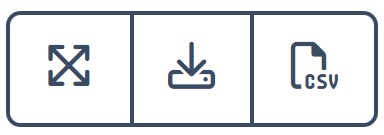 * **`Expand`** icon: Expands the widget across your Dashboard.
* **`Download`** icon: Downloads a `.PNG` file of the widget.
* **`CSV`** icon: Exports the widget’s data as a CSV file.
* You can hide or show any series in the chart by clicking its name in the legend.
* **`Expand`** icon: Expands the widget across your Dashboard.
* **`Download`** icon: Downloads a `.PNG` file of the widget.
* **`CSV`** icon: Exports the widget’s data as a CSV file.
* You can hide or show any series in the chart by clicking its name in the legend.
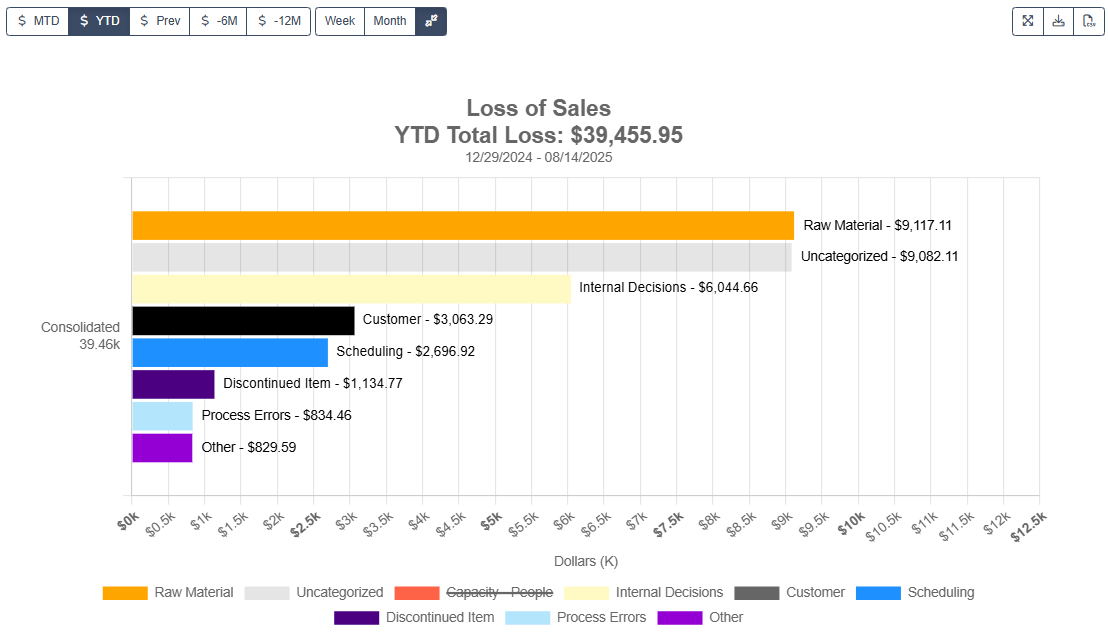 * Click once to cross it out and remove it from the view.
* Click again to restore it.
* On some charts, you can narrow the data to one specific loss reason (e.g., Discontinued Item, Internal Inventory Error, Process Errors).
* Click once to cross it out and remove it from the view.
* Click again to restore it.
* On some charts, you can narrow the data to one specific loss reason (e.g., Discontinued Item, Internal Inventory Error, Process Errors).
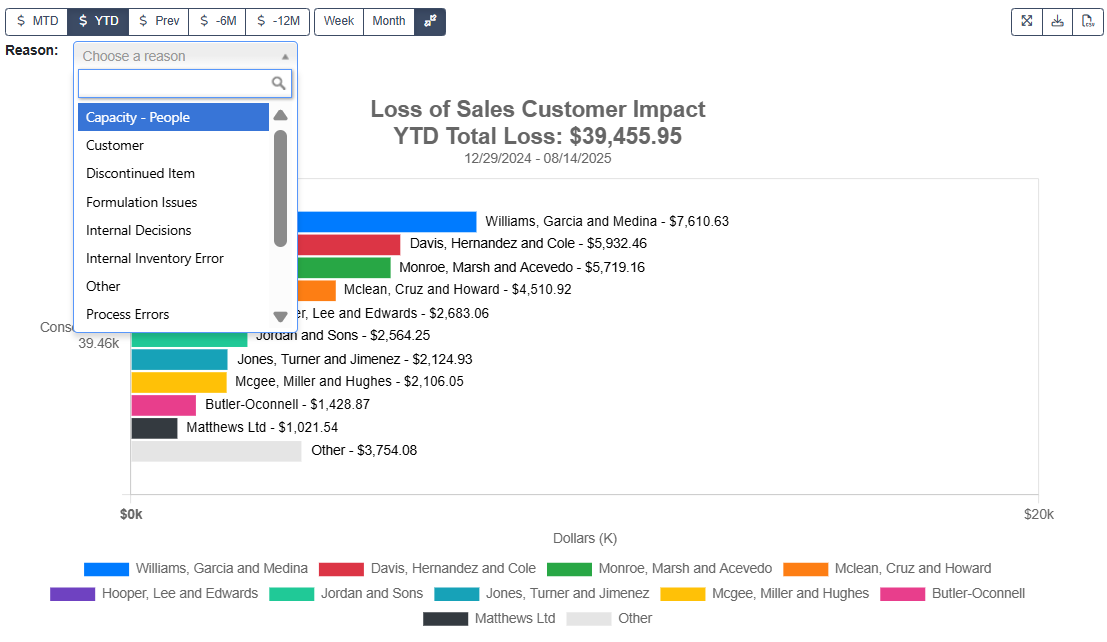 * Click the **Reason** dropdown.
* Select a reason to update the chart with only that reason’s data.
* Use the search bar in the dropdown to quickly find a reason by name.
#### Widgets you can see:
* **Loss of Sales:**
* Click the **Reason** dropdown.
* Select a reason to update the chart with only that reason’s data.
* Use the search bar in the dropdown to quickly find a reason by name.
#### Widgets you can see:
* **Loss of Sales:**
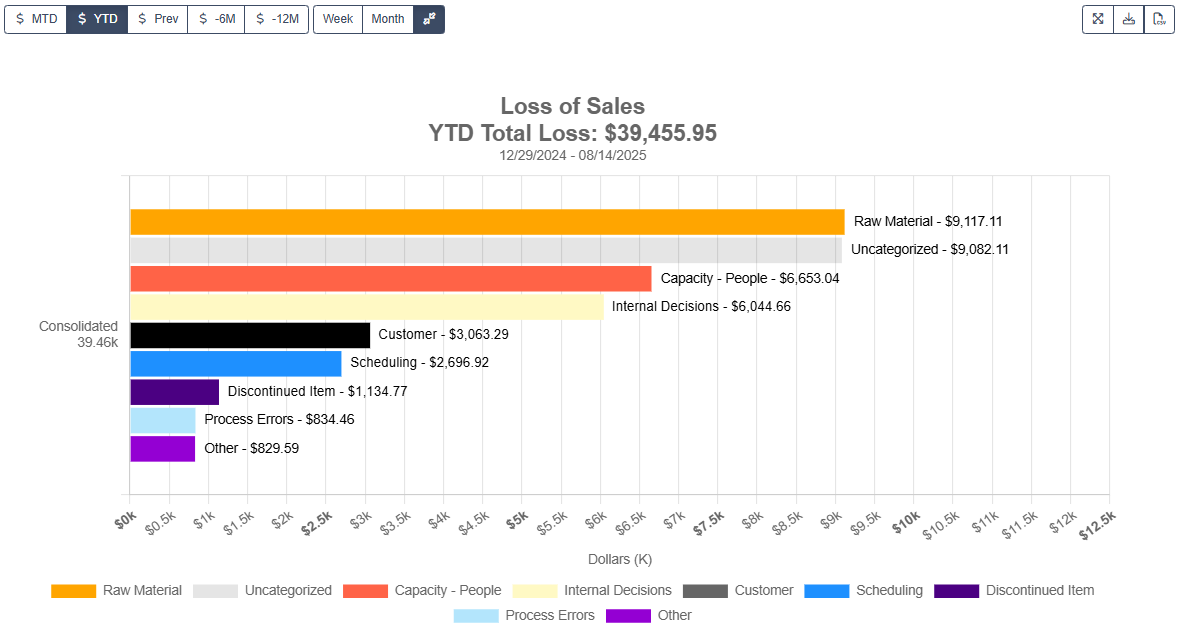 Bar chart of total dollars lost by high-level reason (e.g., Raw Material, Internal Decisions, Capacity - People, Customer, Scheduling, Discontinued Item, Process Errors, Other).
* **Loss of Sales Trend:**
Bar chart of total dollars lost by high-level reason (e.g., Raw Material, Internal Decisions, Capacity - People, Customer, Scheduling, Discontinued Item, Process Errors, Other).
* **Loss of Sales Trend:**
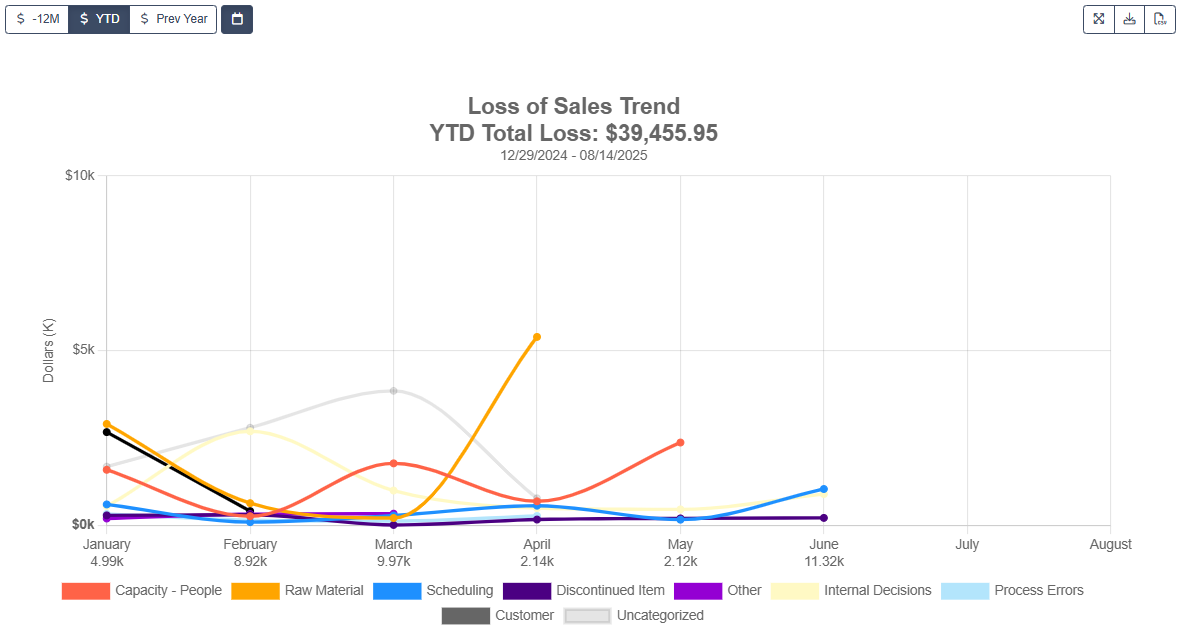 Line chart showing how losses changed over time, broken down by reason.
* **Loss of Sales Reason Breakdown:**
Line chart showing how losses changed over time, broken down by reason.
* **Loss of Sales Reason Breakdown:**
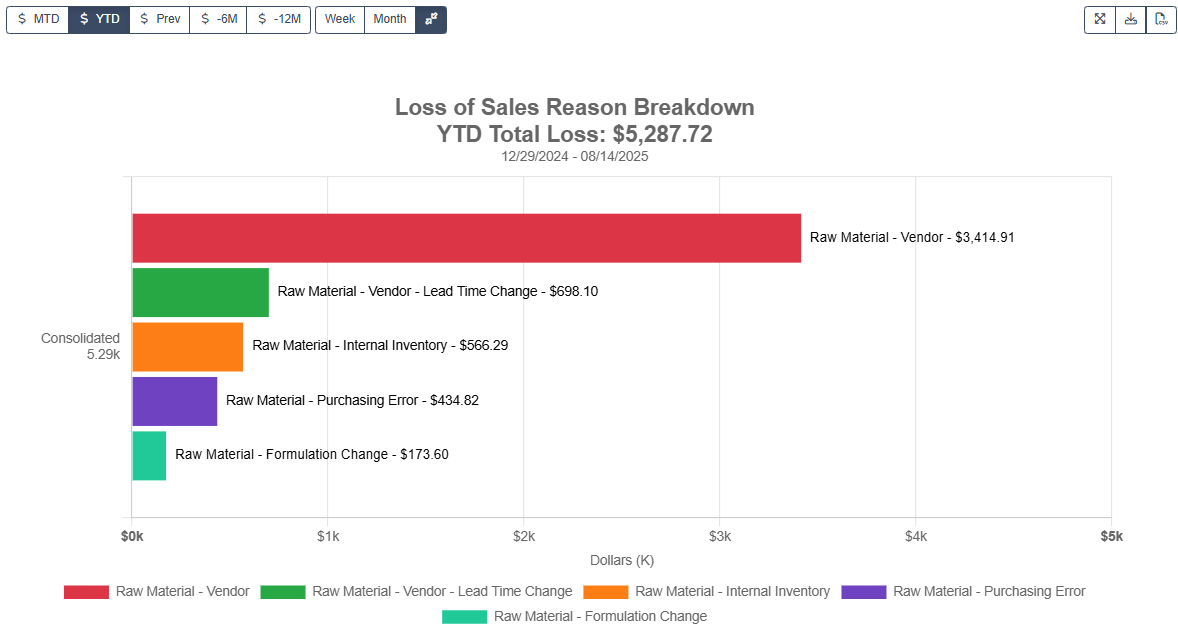 Bar chart showing the dollar impact of sub-reasons within a top-level loss reason (Raw Material in this example), letting you see which specific issues contributed to most losses in the chosen time period.
* **Loss of Sales Customer Impact:**
Bar chart showing the dollar impact of sub-reasons within a top-level loss reason (Raw Material in this example), letting you see which specific issues contributed to most losses in the chosen time period.
* **Loss of Sales Customer Impact:**
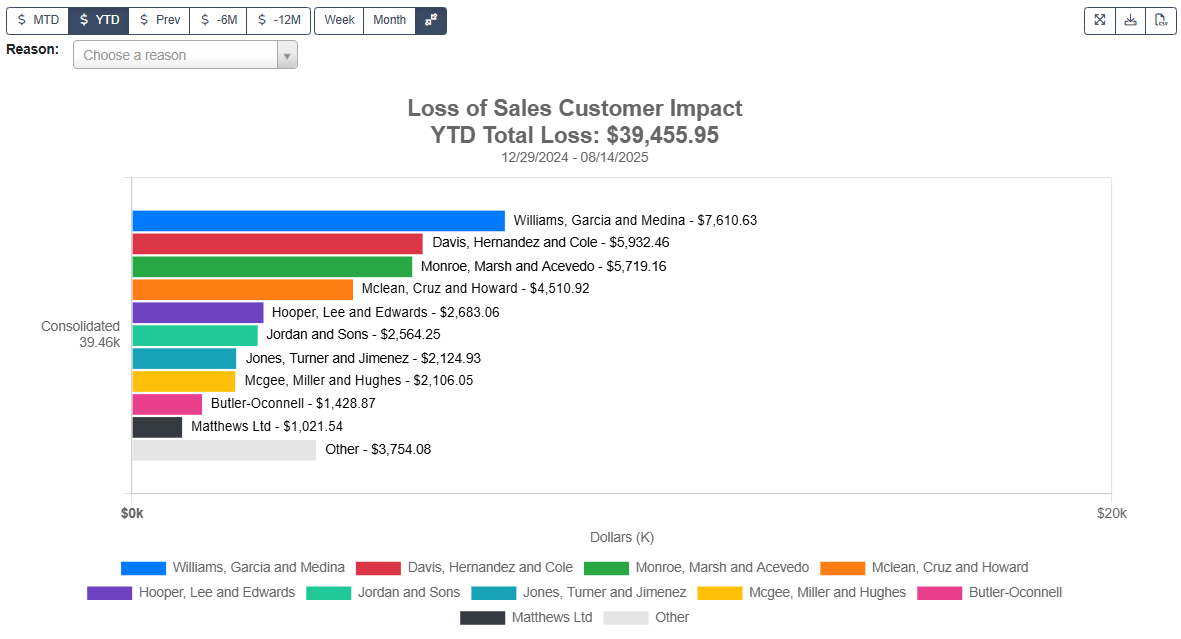 Bar chart showing dollars lost by customer, ranked from highest to lowest impact. Includes a **Reason** filter.
* **Loss of Sales by Purchased Material:**
Bar chart showing dollars lost by customer, ranked from highest to lowest impact. Includes a **Reason** filter.
* **Loss of Sales by Purchased Material:**
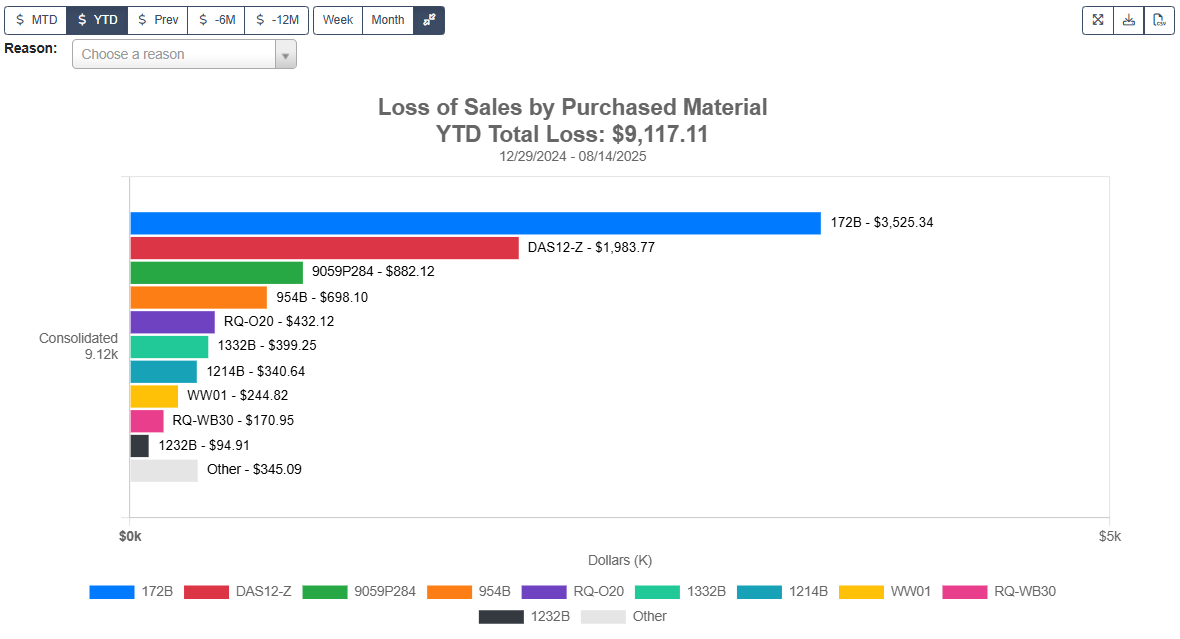 Bar chart of dollars lost tied to specific purchased raw materials (SKUs). Includes a **Reason** filter.
* **Loss of Sales by Purchased Material Vendor:**
Bar chart of dollars lost tied to specific purchased raw materials (SKUs). Includes a **Reason** filter.
* **Loss of Sales by Purchased Material Vendor:**
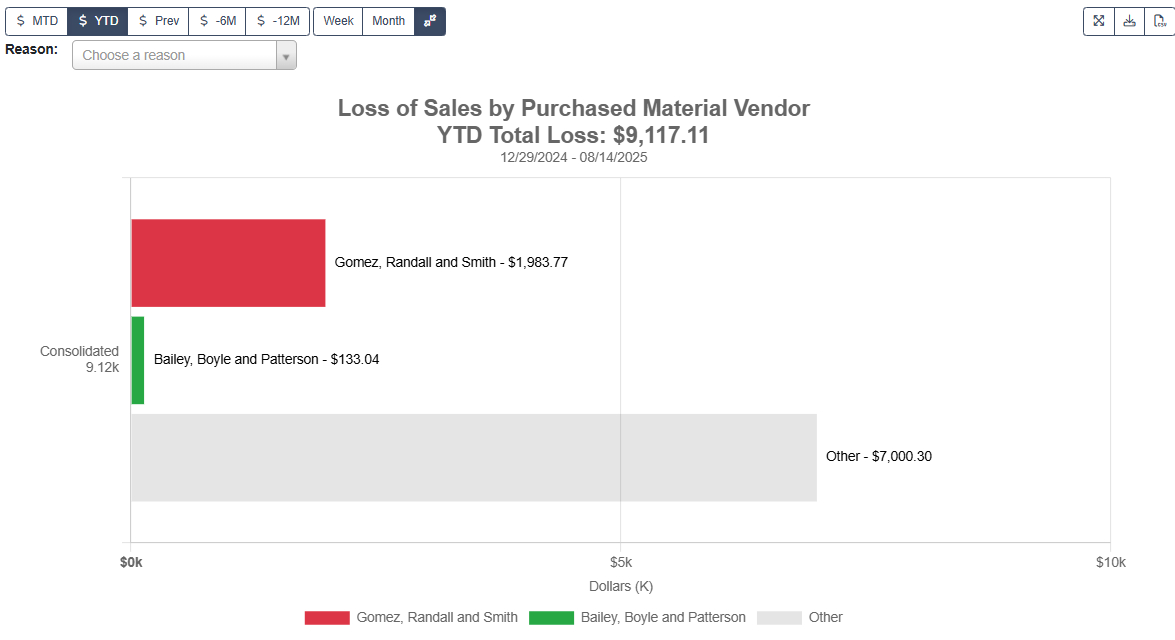 Bar chart showing losses grouped by the vendor supplying the purchased material. Includes a **Reason** filter.
* **Loss of Sales by Purchased Finished Goods (FG):**
Bar chart showing losses grouped by the vendor supplying the purchased material. Includes a **Reason** filter.
* **Loss of Sales by Purchased Finished Goods (FG):**
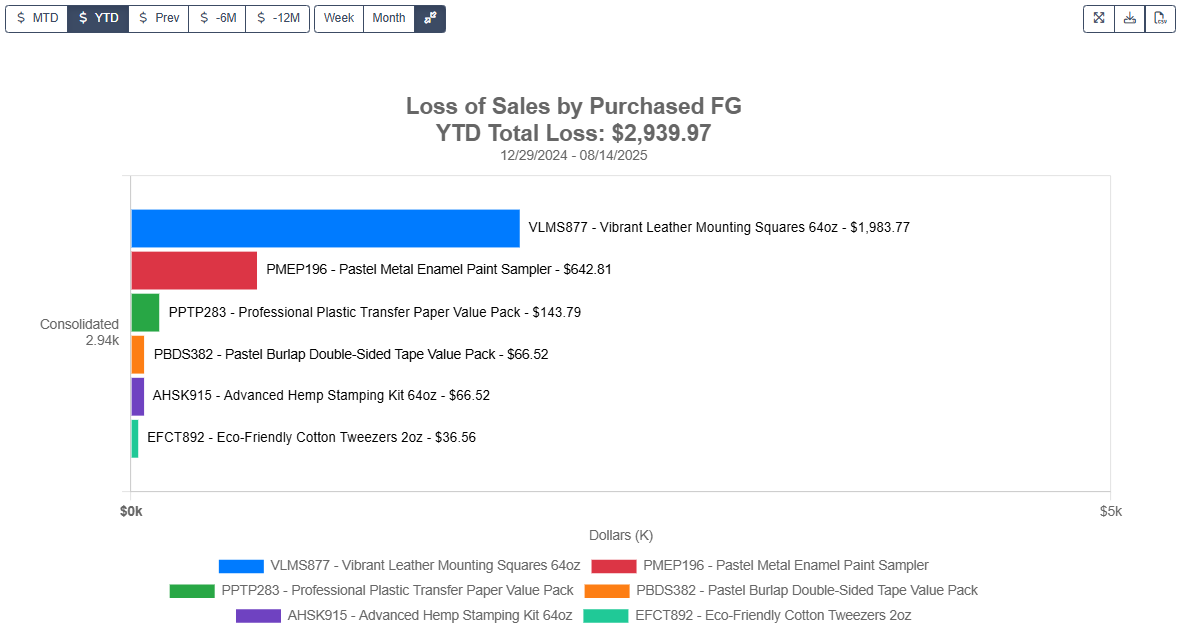 Bar chart of losses caused by purchased finished goods (products bought for resale rather than manufactured).
* **Loss of Sales Manufactured SKU Breakdown:**
Bar chart of losses caused by purchased finished goods (products bought for resale rather than manufactured).
* **Loss of Sales Manufactured SKU Breakdown:**
 Bar chart of losses attributed to manufactured SKUs (blank if no losses recorded for this category).
* **Loss of Sales RM Trend:**
Bar chart of losses attributed to manufactured SKUs (blank if no losses recorded for this category).
* **Loss of Sales RM Trend:**
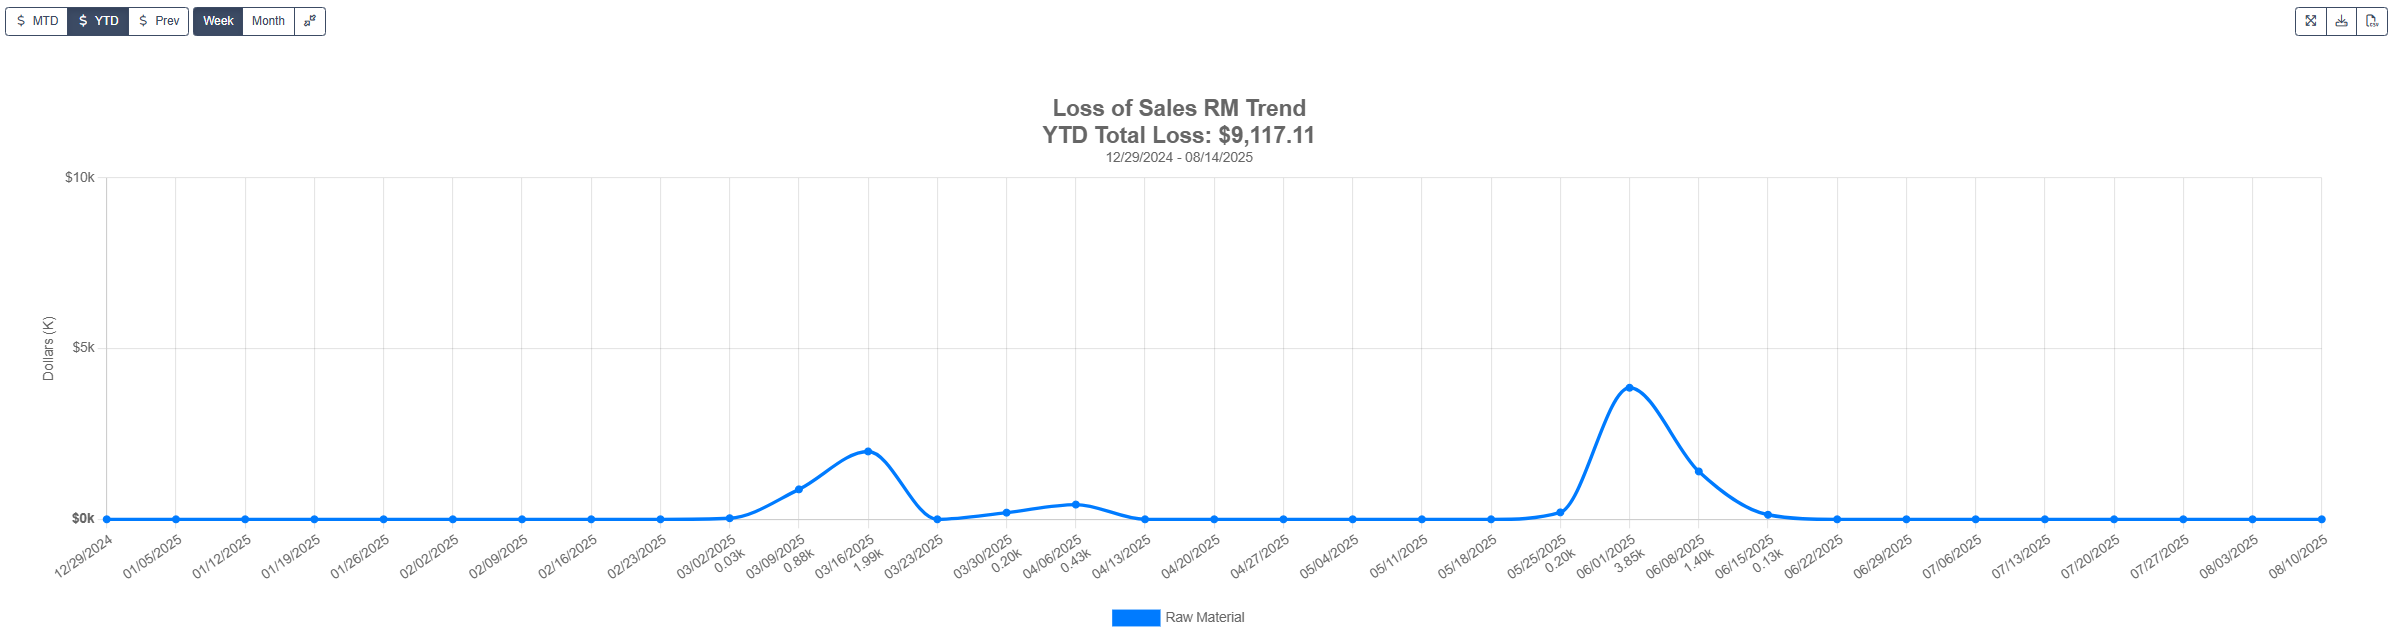 Line chart showing the weekly / monthly trend of losses due to raw materials, allowing you to spot spikes over time.
### View / Edit Loss of Sales
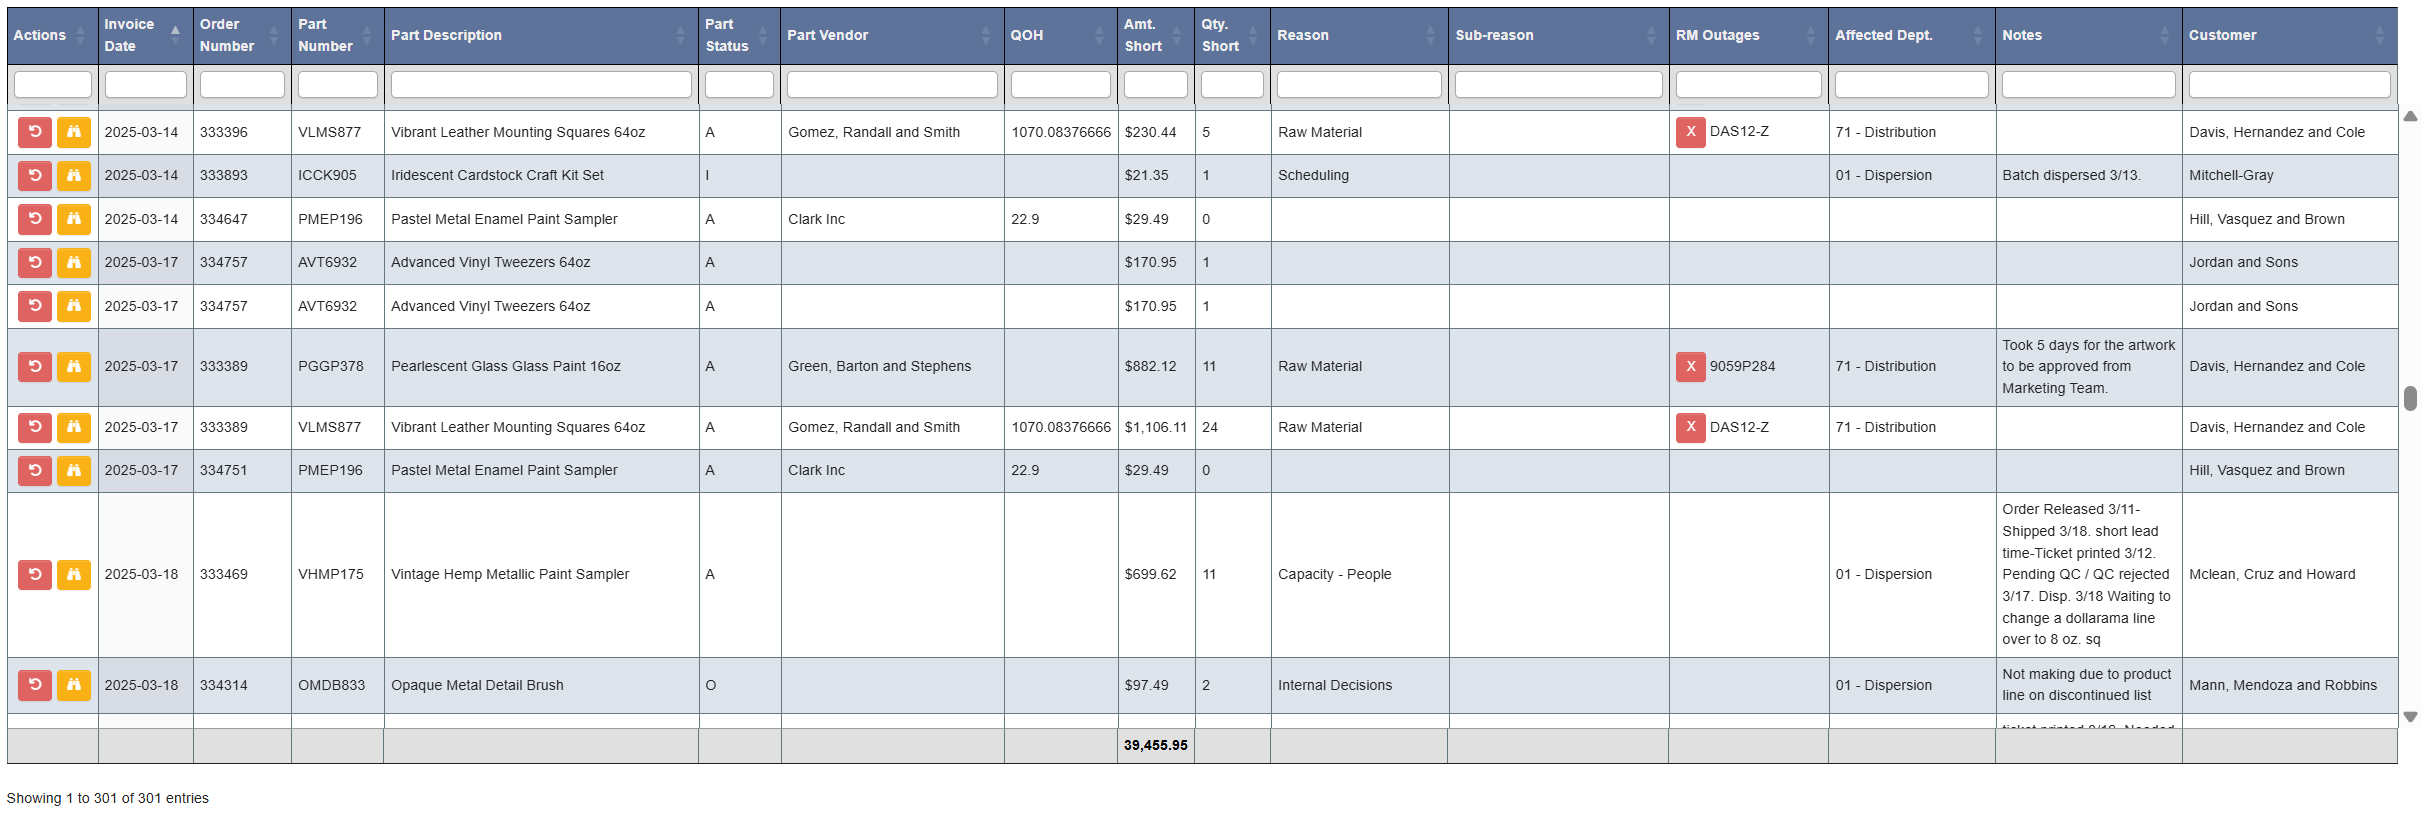
Use this tab to view the data behind the dashboard charts in depth. Here, you can filter, review, and update individual loss records.
Line chart showing the weekly / monthly trend of losses due to raw materials, allowing you to spot spikes over time.
### View / Edit Loss of Sales
Use this tab to view the data behind the dashboard charts in depth. Here, you can filter, review, and update individual loss records.
 #### Filters
* **(Required) Invoice Date**: must be set before running a search.
#### Filters
* **(Required) Invoice Date**: must be set before running a search.
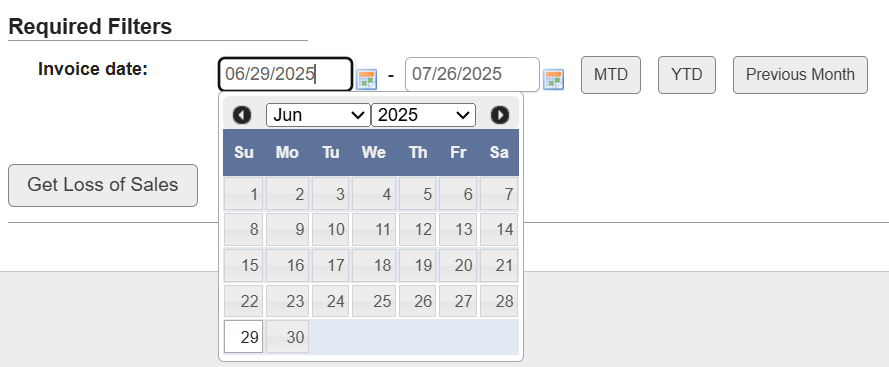 * Manually choose start and end dates from the date pickers, **or**
* Use a quick-select button:
* `MTD`: month-to-date
* `YTD`: year-to-date
* `Previous Month`: previous calendar month
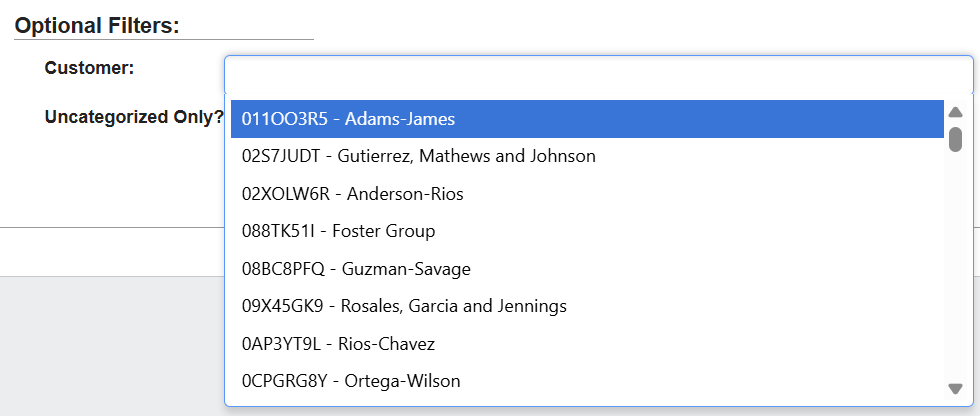
* **(Optional) Customer**: multi-select dropdown. Scroll to browse or type to search. You can select more than one.
* Manually choose start and end dates from the date pickers, **or**
* Use a quick-select button:
* `MTD`: month-to-date
* `YTD`: year-to-date
* `Previous Month`: previous calendar month
* **(Optional) Customer**: multi-select dropdown. Scroll to browse or type to search. You can select more than one.
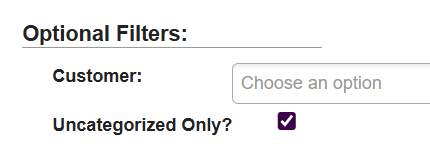
 * **(Optional) Uncategorized Only**: checkbox to limit results to rows without a Reason/Sub-reason assigned.
 #### Report
 #### Action Buttons
* **Yellow binoculars icon**: Opens a **Shortage Information** pop-up with two sections:
#### Action Buttons
* **Yellow binoculars icon**: Opens a **Shortage Information** pop-up with two sections:
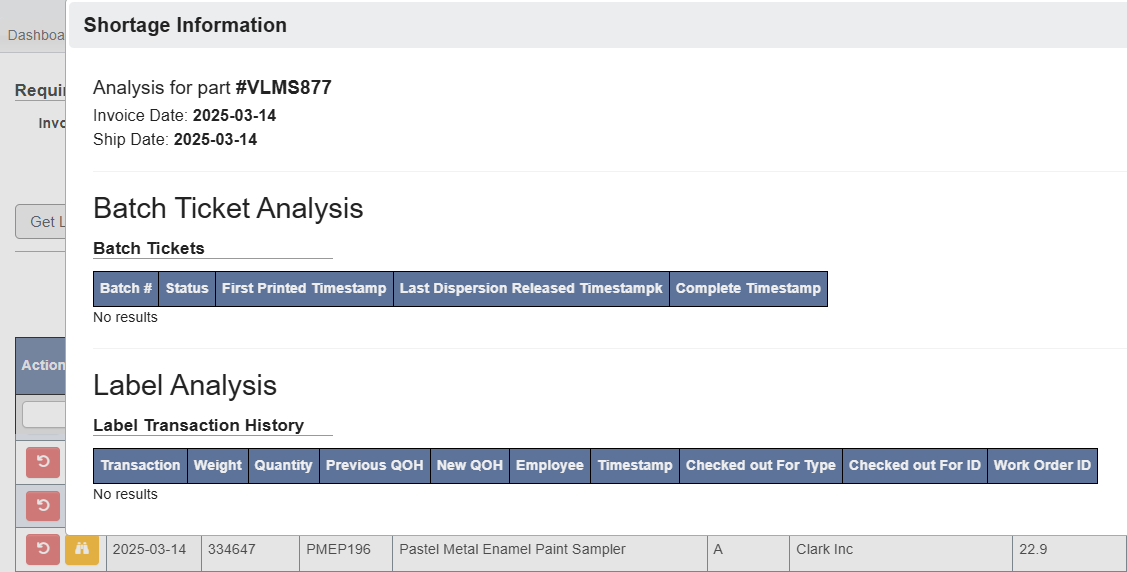 * **Batch Ticket Analysis**: batch numbers, statuses, and timestamps for printing, release, and completion.
* **Label Analysis**: transaction history showing weights, quantities, QOH changes, employees, timestamps, and work order IDs.
* **Red reload/refresh icon**: Clears the **Reason**, **Sub-reason**, and **Affected Dept.** for that row, making it uncategorized.
#### Clearing Field Values
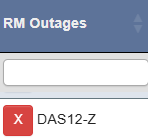
* **Red X icon in RM Outages:** clears the part number in that row.
* **Batch Ticket Analysis**: batch numbers, statuses, and timestamps for printing, release, and completion.
* **Label Analysis**: transaction history showing weights, quantities, QOH changes, employees, timestamps, and work order IDs.
* **Red reload/refresh icon**: Clears the **Reason**, **Sub-reason**, and **Affected Dept.** for that row, making it uncategorized.
#### Clearing Field Values
* **Red X icon in RM Outages:** clears the part number in that row.
 #### Editing Records
Most columns are editable so you can categorize, correct, or add details.
**How to edit:**
1. Click in the field you want to change.
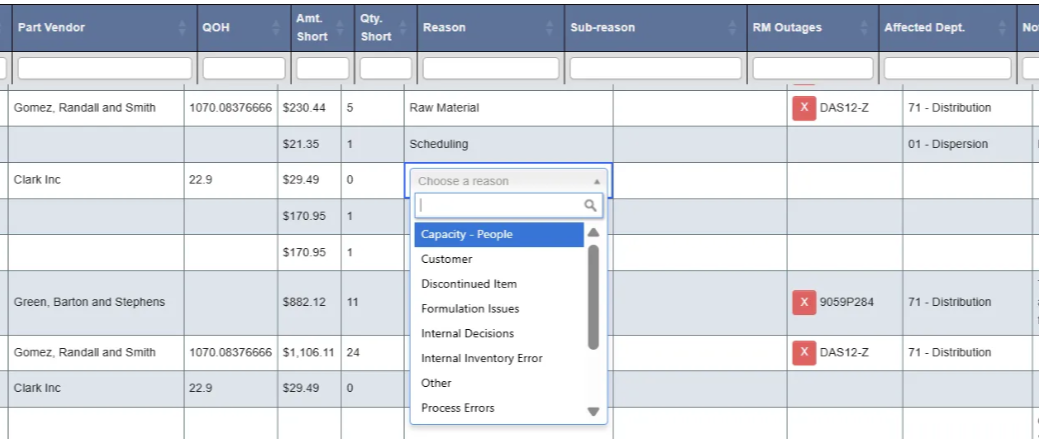
2. For list-based fields, a **dropdown** appears. Scroll or type to search, then click to select.
#### Editing Records
Most columns are editable so you can categorize, correct, or add details.
**How to edit:**
1. Click in the field you want to change.
2. For list-based fields, a **dropdown** appears. Scroll or type to search, then click to select.
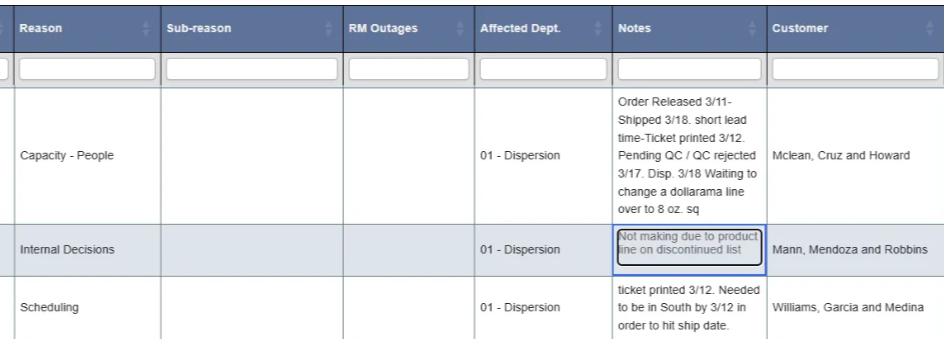
 3. For text-based fields (like Notes), a **text box** appears for direct entry.
 4. Changes save automatically when you click outside the field.
**Editable fields:**
* **Part Vendor**: dropdown of vendors; scroll or search.
* **Reason**: dropdown of top-level loss reasons.
* **Sub-reason**: dropdown tied to the selected Reason (may be empty if no sub-reasons exist).
* **RM Outages**: dropdown of raw material part numbers.
* **Affected Dept.**: dropdown of department codes/names.
* **Notes**: free-text field for explaining what happened.
4. Changes save automatically when you click outside the field.
**Editable fields:**
* **Part Vendor**: dropdown of vendors; scroll or search.
* **Reason**: dropdown of top-level loss reasons.
* **Sub-reason**: dropdown tied to the selected Reason (may be empty if no sub-reasons exist).
* **RM Outages**: dropdown of raw material part numbers.
* **Affected Dept.**: dropdown of department codes/names.
* **Notes**: free-text field for explaining what happened.