> ## Documentation Index
> Fetch the complete documentation index at: https://docs.decoart.com/llms.txt
> Use this file to discover all available pages before exploring further.
# Production Reports Submodule
## Overview
The **Production Tracking** → **Production Reports** submodule provides comprehensive reporting capabilities for manufacturing operations, cost analysis, and production performance monitoring. These reports help you track bottling and dispersion operations, analyze production costs, monitor quality metrics, and identify operational inefficiencies.
Production reports answer critical manufacturing questions such as:
* "How did our bottling lines perform today?"
* "Are we meeting our yield targets for this batch?"
* "Where are the biggest cost variances in production?"
* "Which batches were rejected and why?"
* "How efficient was the dispersion department this shift?"
This page reviews all the types of production reports you can generate, covering everything from daily bottling performance to cost variance analysis and quality control monitoring.
## Report Options
* **Daily Bottling:** Track daily bottling production output, including quantities produced, line efficiency, and product mix across all bottling lines.
* **Bottling EOS:** End-of-shift bottling reports showing production totals, downtime incidents, and shift performance metrics.
* **Bottling Summary:** Comprehensive overview of bottling operations over specified time periods, including throughput analysis and capacity utilization.
* **Bottling Scorecard:** Performance dashboard showing key bottling metrics, quality indicators, and operational efficiency scores.
* **Label Summary:** Summary of label usage and inventory across production operations, tracking consumption patterns and stock levels.
* **Dispersion Summary:** Overview of dispersion department activities, including batch completion rates, material consumption, and production schedules.
* **Cost of Production:** Detailed cost breakdown for production runs, including material costs, labor expenses, and overhead allocation.
* **Usage / Sub. Variance:** Analysis of material usage variances and substitutions, comparing actual consumption against standard requirements.
* **Yield Variance:** Track production yield performance against expected outputs, identifying efficiency gains or losses.
* **Yield/Sub Accrual:** Accrual reports for yield variances and material substitutions, supporting accurate cost accounting.
* **Gross Variance:** Overall variance analysis combining material, labor, and overhead variances for comprehensive cost control.
* **Dispersion Labor:** Labor utilization and productivity reports for dispersion operations, tracking employee efficiency and shift performance.
* **Bottling Downtime:** Detailed analysis of bottling line downtime events, including duration, causes, and impact on production schedules.
* **Rejected Batches:** Reports on batch rejections, including rejection reasons, quantities affected, and corrective actions taken.
* **Transactions:** Detailed transaction logs for production activities, material movements, and inventory adjustments related to manufacturing operations.
* **Dispersion Delayed:** Reports on delayed dispersion batches, identifying bottlenecks and scheduling issues that impact production flow.
* **QC Report:** Quality control reports showing inspection results, defect rates, and compliance metrics across production operations.
## How to Generate a Report
### Generate a Daily Bottling report
 Use the **Daily Bottling** tab to see all bottling jobs for a given date or range. You can group the output by part and adjust the report level for more detail.
To view daily bottling production data:
1. Click the `Daily Bottling` tab.
2. Enter the **Production date** (single day or range).
3. Choose whether to **Ignore 97/98/99**.
4. Choose whether to **Group By Part**.
5. Select a **Report Level** (Level 0 = generic grid, higher levels = more detail).
6. (Optional) Narrow scope by **Shift**, **Line**, **Part**, **Batch Number**, **Product Class** and **Ounce Size**.
7. Click `Generate Report`.
**This report is useful for**: Production Managers and Shift Supervisors to monitor daily output, track line efficiency, and identify production trends.
### Generate a Bottling EOS report
Use the **Daily Bottling** tab to see all bottling jobs for a given date or range. You can group the output by part and adjust the report level for more detail.
To view daily bottling production data:
1. Click the `Daily Bottling` tab.
2. Enter the **Production date** (single day or range).
3. Choose whether to **Ignore 97/98/99**.
4. Choose whether to **Group By Part**.
5. Select a **Report Level** (Level 0 = generic grid, higher levels = more detail).
6. (Optional) Narrow scope by **Shift**, **Line**, **Part**, **Batch Number**, **Product Class** and **Ounce Size**.
7. Click `Generate Report`.
**This report is useful for**: Production Managers and Shift Supervisors to monitor daily output, track line efficiency, and identify production trends.
### Generate a Bottling EOS report
 Use the **Bottle EOS** tab to review shift-level performance at the end of shift (EOS).
1. Click the `Bottling EOS` tab.
2. Enter the **Production date** (single day or range).
3. Choose whether to **Ignore 97/98/99**.
4. (Optional) Narrow scope by **Shift**, **Line**, and **Employee.**
5. Choose whether to show **Summary Only.**
6. Click `Generate Report`.
**This report is useful for:** Shift Supervisors and Production Managers to review shift performance, track downtime incidents, and plan next shift activities.
### Generate a Bottling Summary report
Use the **Bottle EOS** tab to review shift-level performance at the end of shift (EOS).
1. Click the `Bottling EOS` tab.
2. Enter the **Production date** (single day or range).
3. Choose whether to **Ignore 97/98/99**.
4. (Optional) Narrow scope by **Shift**, **Line**, and **Employee.**
5. Choose whether to show **Summary Only.**
6. Click `Generate Report`.
**This report is useful for:** Shift Supervisors and Production Managers to review shift performance, track downtime incidents, and plan next shift activities.
### Generate a Bottling Summary report
 To view comprehensive bottling operations overview:
1. Click the `Bottling Summary` tab.
2. Set the required filters:
* **Report Metric**: Choose measurement(s) to show in the report (Gallons, Dollars, Bottles, Efficiency).
* **Group by Line or Shift**: Break down results by production line or by work shift.
* **Group by Week or Day**: Choose whether results are aggregated daily or summarized weekly.
* **Production date**: Single day or range.
3. Choose whether to **Ignore 97/98/99**.
4. Click `Generate Report`.
**This report is useful for:** Operations Directors and Plant Managers to analyze throughput trends, capacity utilization, and overall bottling performance.
### Generate a Bottling Scorecard report
To view comprehensive bottling operations overview:
1. Click the `Bottling Summary` tab.
2. Set the required filters:
* **Report Metric**: Choose measurement(s) to show in the report (Gallons, Dollars, Bottles, Efficiency).
* **Group by Line or Shift**: Break down results by production line or by work shift.
* **Group by Week or Day**: Choose whether results are aggregated daily or summarized weekly.
* **Production date**: Single day or range.
3. Choose whether to **Ignore 97/98/99**.
4. Click `Generate Report`.
**This report is useful for:** Operations Directors and Plant Managers to analyze throughput trends, capacity utilization, and overall bottling performance.
### Generate a Bottling Scorecard report
 To view bottling performance metrics dashboard:
1. Click the `Bottling Scorecard` tab.
2. Set the required filters:
* **Production date:** Single day or range.
* **Operator:** Choose from an operator from the drop down menu.
* **# of Shifts:** Choose what day range of shifts to cover in the report (30, 60, 90, 120, 1 year).
* There are additional options to see operators from the day before, 2 days before or 3 days before.
3. Click `Generate Report`.
**This report is useful for:** Operations Directors and Plant Managers to assess performance, identify improvement areas, and track operational excellence.
### Generate a Label Summary report
To view bottling performance metrics dashboard:
1. Click the `Bottling Scorecard` tab.
2. Set the required filters:
* **Production date:** Single day or range.
* **Operator:** Choose from an operator from the drop down menu.
* **# of Shifts:** Choose what day range of shifts to cover in the report (30, 60, 90, 120, 1 year).
* There are additional options to see operators from the day before, 2 days before or 3 days before.
3. Click `Generate Report`.
**This report is useful for:** Operations Directors and Plant Managers to assess performance, identify improvement areas, and track operational excellence.
### Generate a Label Summary report
 To track label usage and inventory:
1. Click the `Label Summary` tab.
2. Set the required filters:
* **Report Metric:** Choose the values in the report (Dollars, Labels).
* **Production date:** Single day or range.
3. Click `Generate Report`.
**This report is useful for:** Inventory Managers and Production Planners to monitor label consumption, track inventory levels, and plan label procurement.
### Generate a Dispersion Summary report
To track label usage and inventory:
1. Click the `Label Summary` tab.
2. Set the required filters:
* **Report Metric:** Choose the values in the report (Dollars, Labels).
* **Production date:** Single day or range.
3. Click `Generate Report`.
**This report is useful for:** Inventory Managers and Production Planners to monitor label consumption, track inventory levels, and plan label procurement.
### Generate a Dispersion Summary report
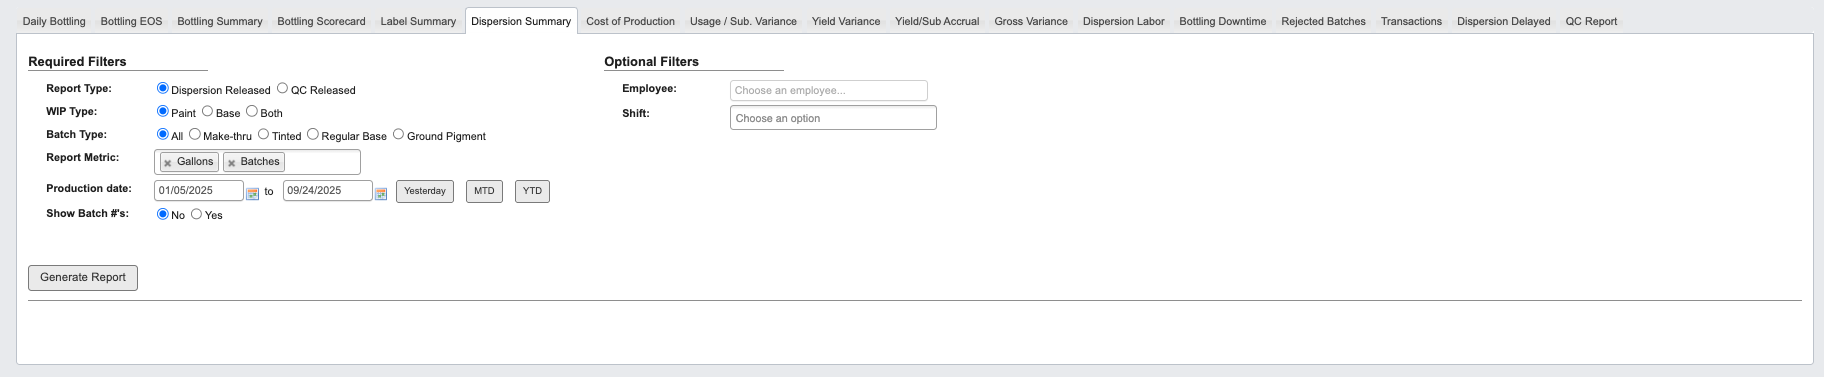 To view dispersion department performance:
1. Click the `Dispersion Summary` tab.
2. Set the required filters:
* **Report Type:** Choose Dispersion Released or QC Released.
* **WIP Type:** Choose Paint, Base or Both.
* **Batch Type:** Choose All, Make-thru, Tinted, Regular Base or Ground Pigment.
* **Report Metric:** Choose measurement(s) to show in the report (Gallons, Batches).
* **Production date:** Single day or range.
* **Show Batch #'s:** Choose to show the batch numbers.
3. (Optional) Narrow scope by **Employee** or **Shift.**
4. Click `Generate Report`.
**This report is useful for:** Production Schedulers and Dispersion Supervisors to monitor batch completion rates, track material consumption, and optimize scheduling.
### Generate a Cost of Production report
To view dispersion department performance:
1. Click the `Dispersion Summary` tab.
2. Set the required filters:
* **Report Type:** Choose Dispersion Released or QC Released.
* **WIP Type:** Choose Paint, Base or Both.
* **Batch Type:** Choose All, Make-thru, Tinted, Regular Base or Ground Pigment.
* **Report Metric:** Choose measurement(s) to show in the report (Gallons, Batches).
* **Production date:** Single day or range.
* **Show Batch #'s:** Choose to show the batch numbers.
3. (Optional) Narrow scope by **Employee** or **Shift.**
4. Click `Generate Report`.
**This report is useful for:** Production Schedulers and Dispersion Supervisors to monitor batch completion rates, track material consumption, and optimize scheduling.
### Generate a Cost of Production report
 To analyze detailed production costs:
1. Click the `Cost of Production` tab.
2. Set the required filters:
* **Production date:** Single day or range.
* **Part type**: Choose WIP only, FG only or All.
* **Costs from**: Choose a year.
3. Click `Generate Report`.
**This report is useful for**: Cost Analysts and Finance Teams to monitor production expenses, analyze cost trends, and support pricing decisions.
### Generate a Usage / Sub. Variance report
To analyze detailed production costs:
1. Click the `Cost of Production` tab.
2. Set the required filters:
* **Production date:** Single day or range.
* **Part type**: Choose WIP only, FG only or All.
* **Costs from**: Choose a year.
3. Click `Generate Report`.
**This report is useful for**: Cost Analysts and Finance Teams to monitor production expenses, analyze cost trends, and support pricing decisions.
### Generate a Usage / Sub. Variance report
 To analyze material usage and substitution variances:
1. Click the `Usage / Sub. Variance` tab.
2. Set the required filters:
* **Production type**: Choose Dispersion or Bottling.
* **Part type**: Choose RM only, WIP only or All.
* **Open Batches Only**: Check the checkbox to show.
* **QC released date**: Date range OR Choose to filter by **Initial dispersion date**: Date range.
* **Show no variance?** Choose Yes No.
* **Costs from**: Choose a year.
3. Click `Generate Report`.
**This report is useful for**: **Cost Analysts and Production Managers** to identify material efficiency issues, track substitution impacts, and control material costs.
### Generate a Yield Variance report
To analyze material usage and substitution variances:
1. Click the `Usage / Sub. Variance` tab.
2. Set the required filters:
* **Production type**: Choose Dispersion or Bottling.
* **Part type**: Choose RM only, WIP only or All.
* **Open Batches Only**: Check the checkbox to show.
* **QC released date**: Date range OR Choose to filter by **Initial dispersion date**: Date range.
* **Show no variance?** Choose Yes No.
* **Costs from**: Choose a year.
3. Click `Generate Report`.
**This report is useful for**: **Cost Analysts and Production Managers** to identify material efficiency issues, track substitution impacts, and control material costs.
### Generate a Yield Variance report
 To track production yield performance:
1. Click the `Yield Variance` tab.
2. Set the required filters:
* **Completed date**: Date range.
* **Batch type**: Choose WIP only, Bases only or All.
* **Costs from**: Choose a year.
3. Click `Generate Report`.
**This report is useful for**: Production Managers and Quality Teams to monitor yield efficiency, identify process improvements, and reduce waste.
### Generate a Yield / Sub Accrual report
To track production yield performance:
1. Click the `Yield Variance` tab.
2. Set the required filters:
* **Completed date**: Date range.
* **Batch type**: Choose WIP only, Bases only or All.
* **Costs from**: Choose a year.
3. Click `Generate Report`.
**This report is useful for**: Production Managers and Quality Teams to monitor yield efficiency, identify process improvements, and reduce waste.
### Generate a Yield / Sub Accrual report
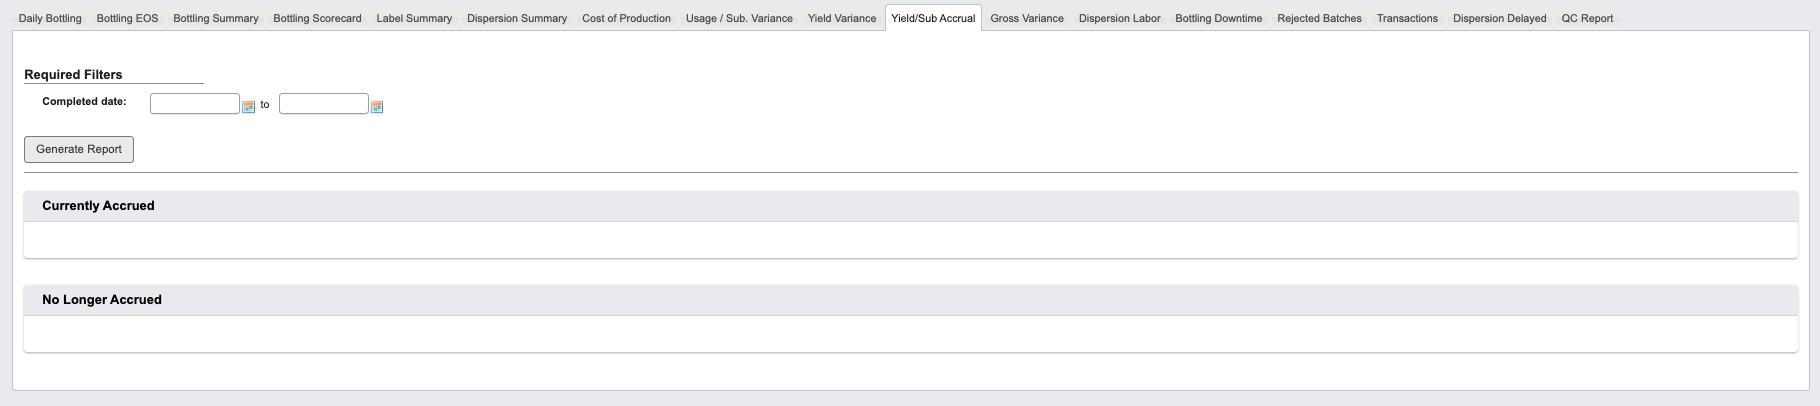 To view currently accrued vs no longer accrued yield and substitution accruals:
1. Click the `Yield / Sub Accrual` tab.
2. Enter the **Completed date** range.
3. Click `Generate Report`.
**This report is useful for**: Finance Teams and Cost Accountants to support month-end closing, ensure accurate cost accounting, and track accrual adjustments.
### Generate a Gross Variance report
To view currently accrued vs no longer accrued yield and substitution accruals:
1. Click the `Yield / Sub Accrual` tab.
2. Enter the **Completed date** range.
3. Click `Generate Report`.
**This report is useful for**: Finance Teams and Cost Accountants to support month-end closing, ensure accurate cost accounting, and track accrual adjustments.
### Generate a Gross Variance report
 To analyze overall production variances:
1. Click the `Gross Variance` tab.
2. Set the required filters:
* **Production / QC Released Date**: Select the date range.
* **Batch type:** Choose WIP only, FG only or All.
* **Costs from:** Choose year.
3. Click `Generate Report`.
**This report is useful for**: Finance Directors and Plant Managers \*\*\*\*to understand total cost variances, identify major cost drivers, and implement cost control measures.
### Generate a Dispersion Labor report
To analyze overall production variances:
1. Click the `Gross Variance` tab.
2. Set the required filters:
* **Production / QC Released Date**: Select the date range.
* **Batch type:** Choose WIP only, FG only or All.
* **Costs from:** Choose year.
3. Click `Generate Report`.
**This report is useful for**: Finance Directors and Plant Managers \*\*\*\*to understand total cost variances, identify major cost drivers, and implement cost control measures.
### Generate a Dispersion Labor report
 To analyze dispersion labor utilization:
1. Click the `Dispersion Labor` tab.
2. Set the required filters:
* **Production / QC Released Date**: Select the date range.
* **Costs from:** Choose year.
3. Click `Generate Report`.
**This report is useful for**: HR Managers and Production Supervisors to track employee productivity, manage workforce planning, and optimize labor allocation.
### Generate a Bottling Downtime report
To analyze dispersion labor utilization:
1. Click the `Dispersion Labor` tab.
2. Set the required filters:
* **Production / QC Released Date**: Select the date range.
* **Costs from:** Choose year.
3. Click `Generate Report`.
**This report is useful for**: HR Managers and Production Supervisors to track employee productivity, manage workforce planning, and optimize labor allocation.
### Generate a Bottling Downtime report
 To analyze bottling line downtime events:
1. Click the `Bottling Downtime` tab.
2. Set the required filters:
* **Production date:** Select the date range.
* **Show raw data?:** Choose to show raw data.
3. (Optional) Narrow scope by Shift(s), Line(s), Reason(s), Equipment.
4. Click `Generate Report`.
**This report is useful for**: Plant Engineers and Maintenance Teams to identify downtime patterns, schedule preventive maintenance, and improve equipment reliability.
### Generate a Rejected Batches report
To analyze bottling line downtime events:
1. Click the `Bottling Downtime` tab.
2. Set the required filters:
* **Production date:** Select the date range.
* **Show raw data?:** Choose to show raw data.
3. (Optional) Narrow scope by Shift(s), Line(s), Reason(s), Equipment.
4. Click `Generate Report`.
**This report is useful for**: Plant Engineers and Maintenance Teams to identify downtime patterns, schedule preventive maintenance, and improve equipment reliability.
### Generate a Rejected Batches report
 To analyze batch rejection data:
1. Click the `Rejected Batches` tab.
2. Choose to see a **Detailed View** or **Summary View**
1. **Detailed View**, set the required filters:
To analyze batch rejection data:
1. Click the `Rejected Batches` tab.
2. Choose to see a **Detailed View** or **Summary View**
1. **Detailed View**, set the required filters:
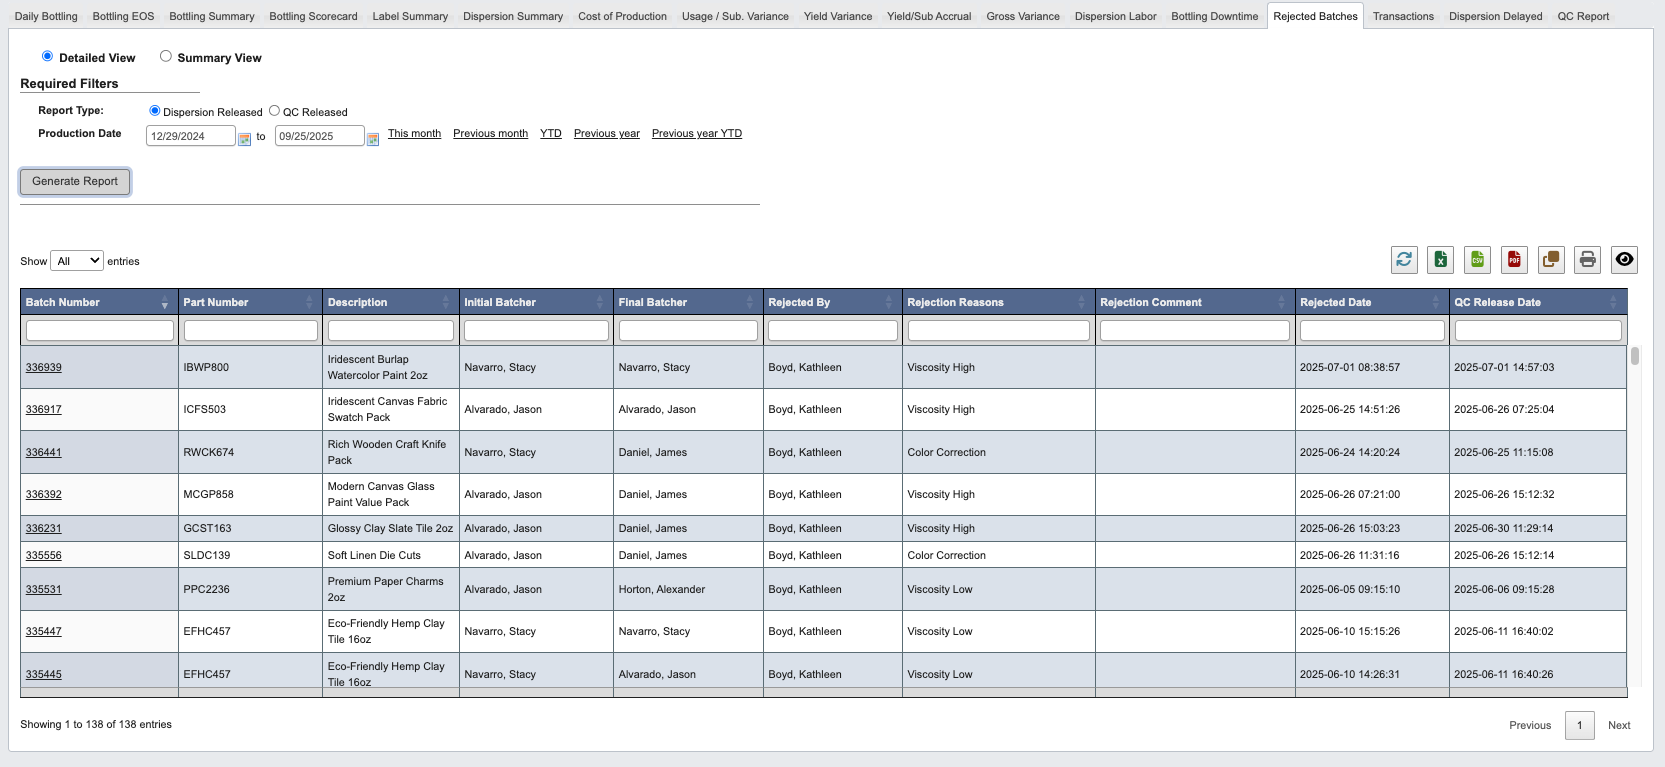
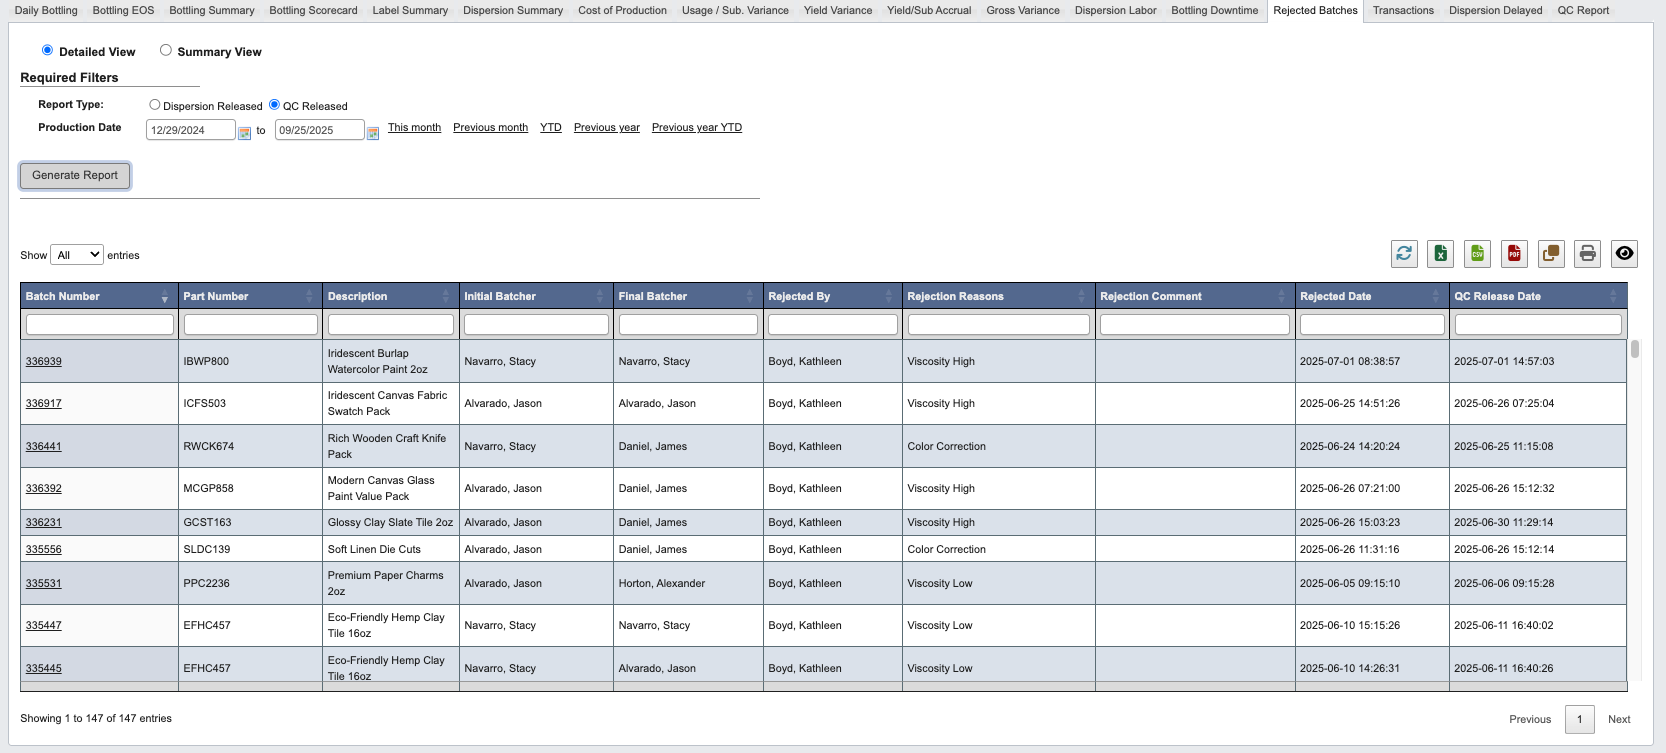 * **Report Type:** Choose Dispersion Released or QC Released.
* **Production Date:** Select the date range.
2. **Summary View,** enter the **Production Date**.
* **Report Type:** Choose Dispersion Released or QC Released.
* **Production Date:** Select the date range.
2. **Summary View,** enter the **Production Date**.
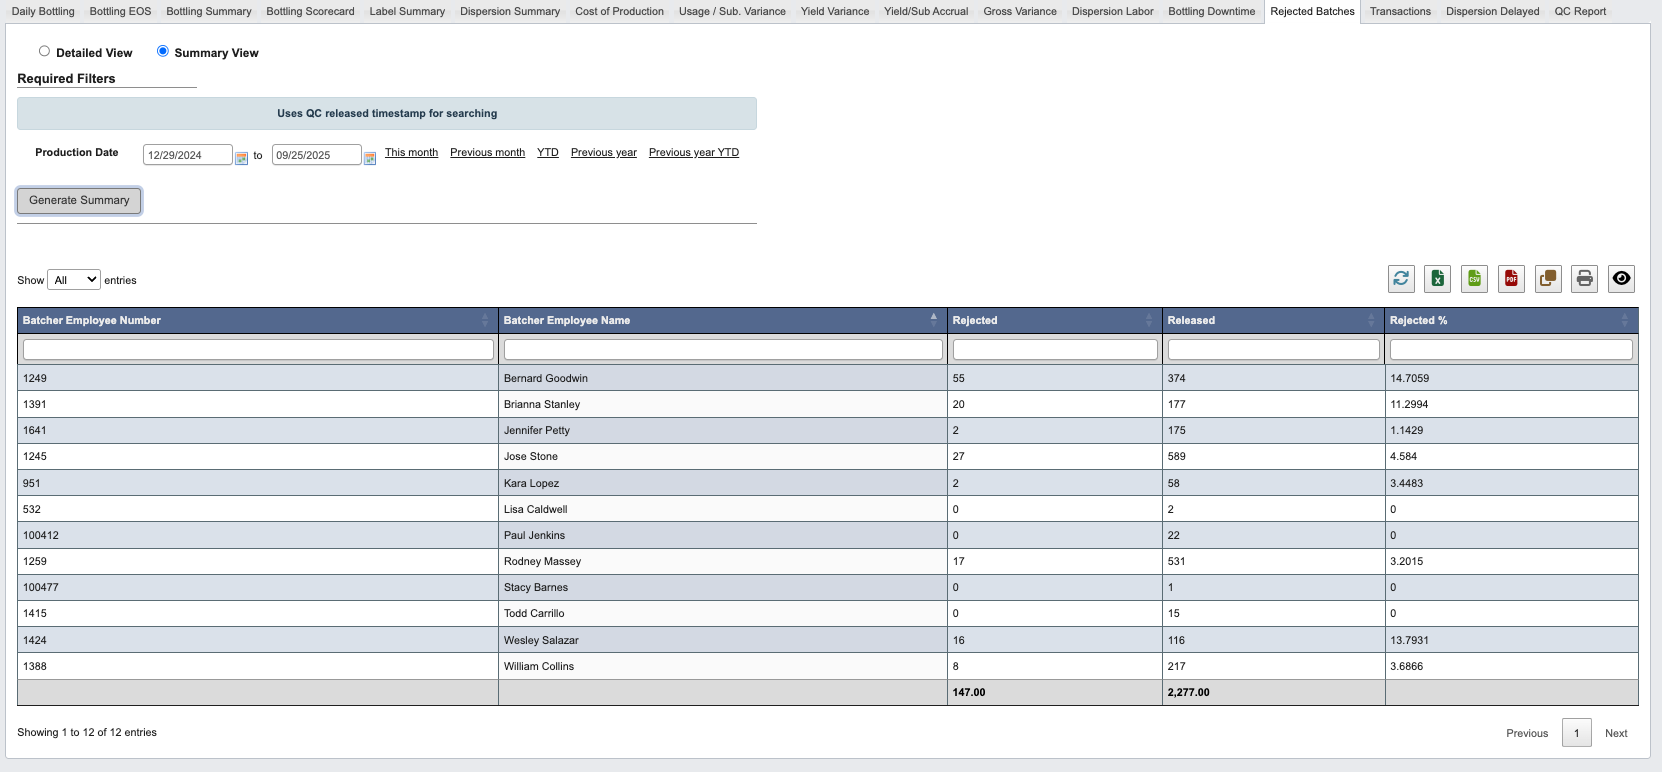 3. Click `Generate Report`.
**This report is useful for**: Quality Control Teams and Production Managers to identify quality issues, track rejection trends, and implement corrective actions.
### Generate a Transactions report
3. Click `Generate Report`.
**This report is useful for**: Quality Control Teams and Production Managers to identify quality issues, track rejection trends, and implement corrective actions.
### Generate a Transactions report
 To view detailed production transaction logs:
1. Click the `Transactions` tab.
2. Set the required filters:
* **Transactions Type:** Choose Batch Tickets or Bottling Jobs.
* **Transaction Date:** Select the date range.
3. Click `Generate Report`.
**This report is useful for**: Inventory Auditors and Operations Managers to trace production activities, investigate discrepancies, and maintain transaction records.
### Generate a Dispersion Delayed report
To view detailed production transaction logs:
1. Click the `Transactions` tab.
2. Set the required filters:
* **Transactions Type:** Choose Batch Tickets or Bottling Jobs.
* **Transaction Date:** Select the date range.
3. Click `Generate Report`.
**This report is useful for**: Inventory Auditors and Operations Managers to trace production activities, investigate discrepancies, and maintain transaction records.
### Generate a Dispersion Delayed report
 To identify delayed dispersion batches:
1. Click the `Dispersion Delayed` tab.
2. Enter the **Delayed Date** range.
3. Click `Generate Report`.
**This report is useful for**: Production Schedulers and Plant Managers to identify bottlenecks, improve scheduling accuracy, and reduce production delays.
### Generate a QC report
To identify delayed dispersion batches:
1. Click the `Dispersion Delayed` tab.
2. Enter the **Delayed Date** range.
3. Click `Generate Report`.
**This report is useful for**: Production Schedulers and Plant Managers to identify bottlenecks, improve scheduling accuracy, and reduce production delays.
### Generate a QC report
 To view quality control inspection results:
1. Click the `QC Report` tab.
2. Set the required filters:
* **WIP Part #:** Choose the WIP Part number.
* **Batch Type:** Choose Paint, Base or Both.
* **QC Released Date:** Select the date range.
3. Click `Generate Report`.
**This report is useful for**: Quality Control Teams and Compliance Officers to monitor inspection results, track defect rates, and ensure quality standards.
To view quality control inspection results:
1. Click the `QC Report` tab.
2. Set the required filters:
* **WIP Part #:** Choose the WIP Part number.
* **Batch Type:** Choose Paint, Base or Both.
* **QC Released Date:** Select the date range.
3. Click `Generate Report`.
**This report is useful for**: Quality Control Teams and Compliance Officers to monitor inspection results, track defect rates, and ensure quality standards.