> ## Documentation Index
> Fetch the complete documentation index at: https://docs.decoart.com/llms.txt
> Use this file to discover all available pages before exploring further.
# Reports Submodule
## Overview
The **Shipping → Reports** submodule helps you track order fulfillment performance, monitor selector productivity, and analyze customer shipping patterns. These reports support the shipping team's weekly priority meetings and daily operations coordination.
Shipping coordinators and logistics managers use these reports frequently to monitor picking performance, track customer shipments, and ensure quality control standards are met throughout the fulfillment process.
## How to Generate a Report
The Shipping reports give you different ways to analyze fulfillment operations and performance. Here are the four main report tabs you'll see in this module:
* **Selector Tracking:** Monitor individual selector performance and picking activity. This report tracks daily picking totals, order completion rates, and part-level picking details to help manage warehouse productivity.
* **Selector Scorecard:** Evaluate selector performance over time with historical data spanning up to one year. This scorecard helps identify top performers and areas for improvement in picking operations.
* **Customer Tracking:** Analyze shipping patterns by customer and shipping method (TL/LTL or SPD).
* **QC Tracking:** Monitor quality control activities and employee performance in the quality assurance process. This ensures products meet standards before shipment to customers.
Each report is designed for different aspects of shipping operations. Together, they help answer questions such as:
* "How are our selectors performing?"
* "Which customers are shipping this week?"
* "Are we meeting quality standards?"
* "What's our picking efficiency?"
## Selector Tracking
 Use the `Selector Tracking` tab to monitor daily picking performance and analyze selector productivity.
1. Click the `Selector Tracking` tab.
2. Set the `Pick date from` (required filter).
3. (Optional) Add filters:
* `Customer(s):` Select specific customers from dropdown.
* `Employee(s):` Select specific selectors from dropdown.
* `Customer detail on summary?:` Choose Yes/No.
* `Show only part picks?:` Choose Yes/No.
4. Click `Generate Report`.
5. Review the results in three sections:
* `Daily Totals:` Overall picking performance for the selected date.
* `Order Pick Totals:` Summary of completed orders.
* `Part Picks:` Detailed part-level picking information.
6. Use toolbar options: `Print`, `Export to Excel`, or `Export to PDF`
**This report is useful for:** Daily operations meetings to review picking performance, identify productivity trends, and manage warehouse staffing.
## Selector Scorecard
Use the `Selector Tracking` tab to monitor daily picking performance and analyze selector productivity.
1. Click the `Selector Tracking` tab.
2. Set the `Pick date from` (required filter).
3. (Optional) Add filters:
* `Customer(s):` Select specific customers from dropdown.
* `Employee(s):` Select specific selectors from dropdown.
* `Customer detail on summary?:` Choose Yes/No.
* `Show only part picks?:` Choose Yes/No.
4. Click `Generate Report`.
5. Review the results in three sections:
* `Daily Totals:` Overall picking performance for the selected date.
* `Order Pick Totals:` Summary of completed orders.
* `Part Picks:` Detailed part-level picking information.
6. Use toolbar options: `Print`, `Export to Excel`, or `Export to PDF`
**This report is useful for:** Daily operations meetings to review picking performance, identify productivity trends, and manage warehouse staffing.
## Selector Scorecard
 Use the `Selector Scorecard` tab to evaluate selector performance over time with historical data and performance metrics. The report will show one card per selector.
.png?fit=max&auto=format&n=y3nhdZFuZ0fMt7du&q=85&s=99f8baaa8ea2b915927c7fef1bef9ff4) This report will search over the last year's worth of data to provide comprehensive performance metrics.
To evaluate selector performance over time:
1. Click the `Selector Scorecard` tab.
2. Set `Picking date` (required).
3. Select `Selector(s)` from dropdown (required). Choose from quick options:
* `Yesterday's Selectors`
* `Selectors from 2 days ago`
* `Selectors from 3 days ago`
4. Select time period: `# of Shifts`, `30`, `60`, `90`, `120`, or `1 year`.
5. Click `Generate Scorecard`.
**This report is useful for:** Performance reviews, identifying training needs, and recognizing top-performing selectors. The scorecard searches over the last year's worth of data for comprehensive performance analysis.
## Customer Tracking
This report will search over the last year's worth of data to provide comprehensive performance metrics.
To evaluate selector performance over time:
1. Click the `Selector Scorecard` tab.
2. Set `Picking date` (required).
3. Select `Selector(s)` from dropdown (required). Choose from quick options:
* `Yesterday's Selectors`
* `Selectors from 2 days ago`
* `Selectors from 3 days ago`
4. Select time period: `# of Shifts`, `30`, `60`, `90`, `120`, or `1 year`.
5. Click `Generate Scorecard`.
**This report is useful for:** Performance reviews, identifying training needs, and recognizing top-performing selectors. The scorecard searches over the last year's worth of data for comprehensive performance analysis.
## Customer Tracking
 Use the `Customer Tracking` tab to analyze shipping patterns by customer and shipping method for priority planning.
To track customer shipping patterns and priorities:
1. Click the `Customer Tracking` tab.
2. Select `Ship Method` (required): TL / LTL or SPD.
3. (Optional) Add filters:
* `Customer(s):` Select specific customers from dropdown
* `Pick date from:` Set date range for analysis
4. Click `Generate Report`.
Use the `Customer Tracking` tab to analyze shipping patterns by customer and shipping method for priority planning.
To track customer shipping patterns and priorities:
1. Click the `Customer Tracking` tab.
2. Select `Ship Method` (required): TL / LTL or SPD.
3. (Optional) Add filters:
* `Customer(s):` Select specific customers from dropdown
* `Pick date from:` Set date range for analysis
4. Click `Generate Report`.
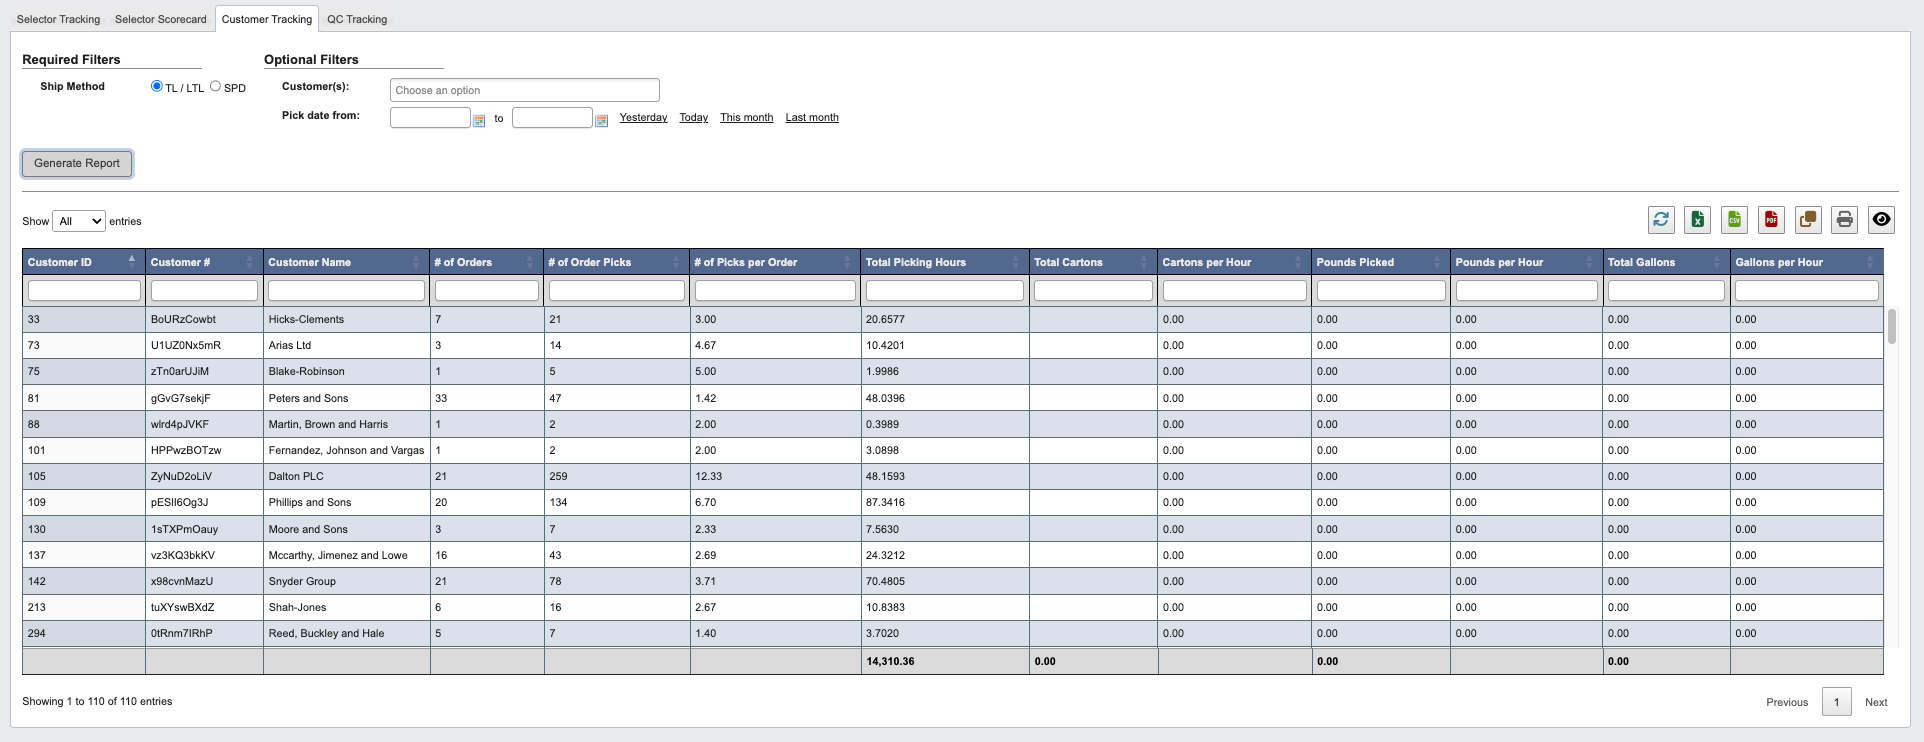 5. Review customer shipping data to support priority planning and resource allocation.
**This report is useful for:** Supporting weekly customer priority meetings and coordinating shipments for major customers.
## QC Tracking
5. Review customer shipping data to support priority planning and resource allocation.
**This report is useful for:** Supporting weekly customer priority meetings and coordinating shipments for major customers.
## QC Tracking
 Use the `QC Tracking` tab to monitor quality control activities and employee performance in the quality assurance process.
To track quality control activities and performance:
1. Click the `QC Tracking` tab.
2. Set `QC date from` (required filter).
3. (Optional) Select `Employee(s)` from dropdown to focus on specific QC personnel.
4. Click `Generate Report`.
Use the `QC Tracking` tab to monitor quality control activities and employee performance in the quality assurance process.
To track quality control activities and performance:
1. Click the `QC Tracking` tab.
2. Set `QC date from` (required filter).
3. (Optional) Select `Employee(s)` from dropdown to focus on specific QC personnel.
4. Click `Generate Report`.
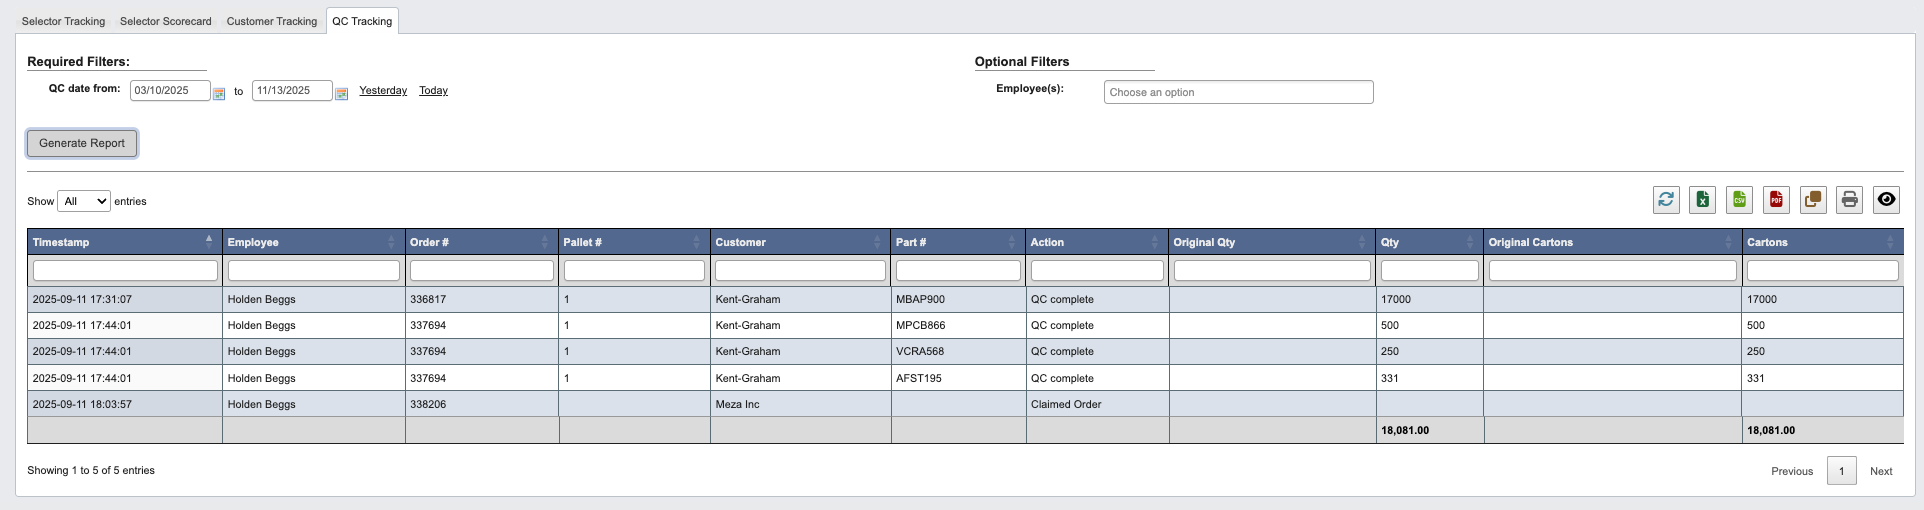 5. Review QC activities and identify any quality issues that need attention before products can be shipped to customers.
**This report is useful for:** Monitoring quality control processes and ensuring products meet standards before shipment
5. Review QC activities and identify any quality issues that need attention before products can be shipped to customers.
**This report is useful for:** Monitoring quality control processes and ensuring products meet standards before shipment