Overview
The Part Information → Reports submodule provides comprehensive reporting capabilities for part analysis, cost management, and inventory tracking. These reports help you analyze part usage patterns, monitor costs across different time periods, track inventory adjustments, and manage formulation changes. Part information reports answer critical business questions such as:- “What parts are used in this finished good and what do they cost?”
- “Which finished goods use this raw material?”
- “How have material costs changed over time?”
- “What inventory adjustments were made this month?”
- “Which batches were scrapped and why?”
- “When will stock run out for purchased parts?”
Report Options
Each tab in the Reports submodule provides different analytical views of your part data:- Bill of Materials: Generate detailed cost breakdowns for manufactured parts, showing all part costs and labor requirements.
- Individual Used-On: Track where specific raw materials or parts are used across finished goods, helpful for impact analysis when discontinuing parts.
- Bulk Component Usage: Analyze usage patterns for multiple parts simultaneously.
- Used-On Summary: Comprehensive view of part usage across the business, based on invoices, orders, or production data.
- Used-On Summary (Production): Production-focused usage analysis based on actual manufacturing consumption and inventory adjustments.
- Current Costs: View and rebuild current cost structures for all parts, supporting real-time pricing decisions.
- Standard Costs: Manage standard cost baselines used for variance analysis and budgeting.
- Future Costs: Plan and model future cost scenarios for strategic planning and pricing.
- Part Requirements: Analyze inventory needs and purchasing requirements for active parts.
- Inventory Adjustments: Track and audit all inventory adjustments with approval status and reasoning.
- Scrap Report: Monitor scrapped materials by department, shift, and reason for quality control and cost management.
- Base Listing: Generate comprehensive part listings excluding obsolete work-in-process items.
- Formulation Changes: Track formula modifications over time for compliance and quality control.
- Get Well Dates: Monitor when purchased parts will run out of stock based on current usage and lead times.
How to Generate a Report
Some reports contain both Required Filters and Optional Filters. A report will not generate until you fill in all required filters.
Generate a Bill of Materials report
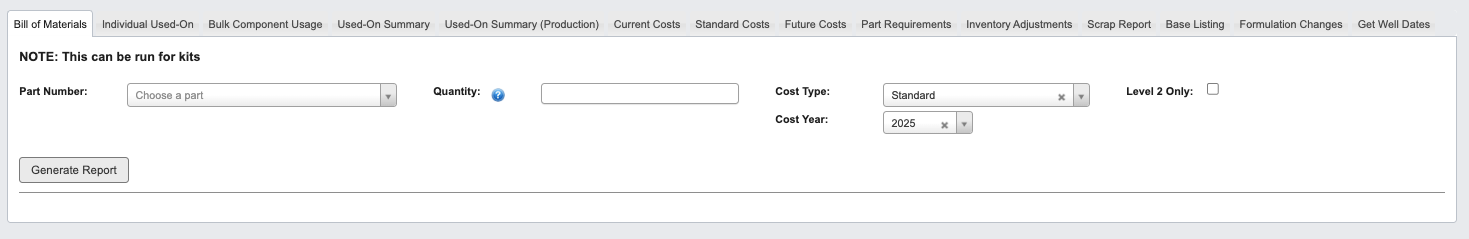
- Click the
Bill of Materialstab. - Set the required filters:
Part number: Choose or type the part number you want to analyze.Quantity: Leave blank for standard batch yield, or enter a specific quantity.Cost Type: Select Standard, Current, or Future costs.Cost Year: Choose the cost year for analysis.- (Optional) Check Level 2 Only to limit the breakdown. See Manage Formula Reference for more on Level 2.
- Click
Generate Report.
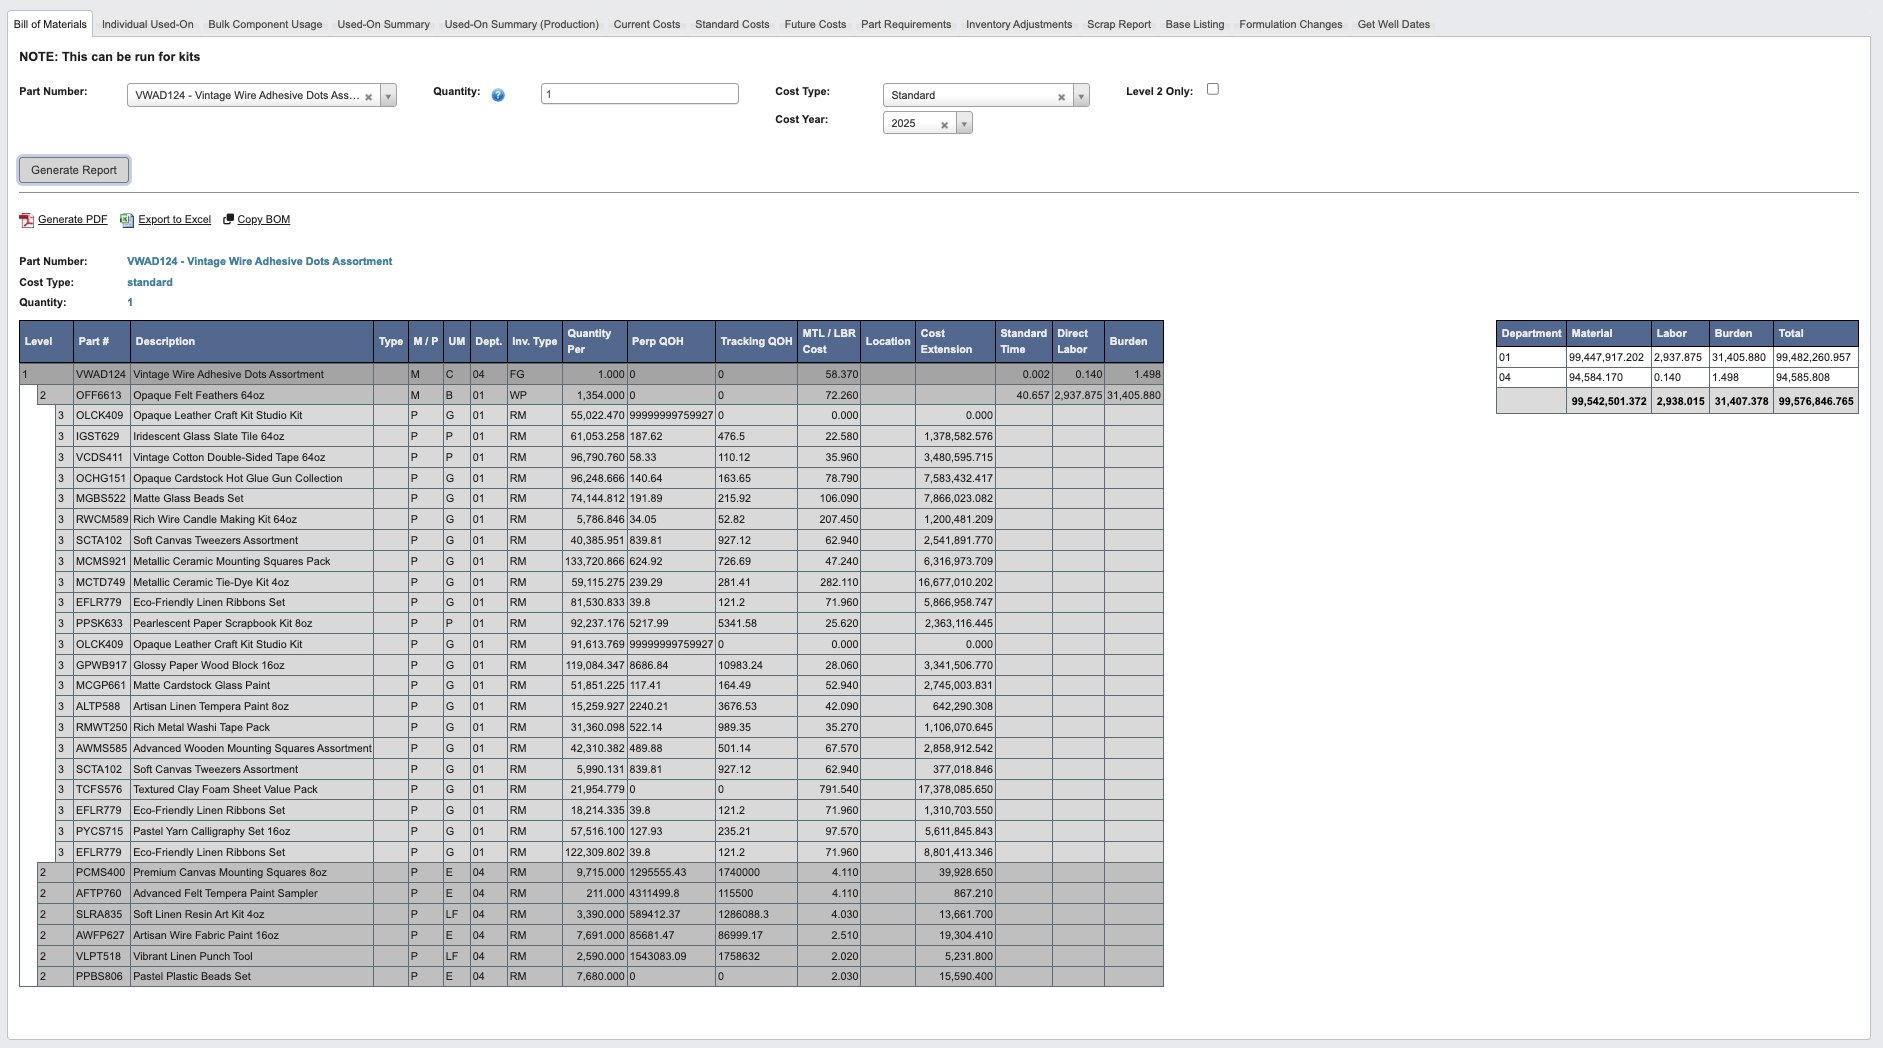
This report can be run for kits as well as regular manufactured parts.
Example of a Bill of Materials Report
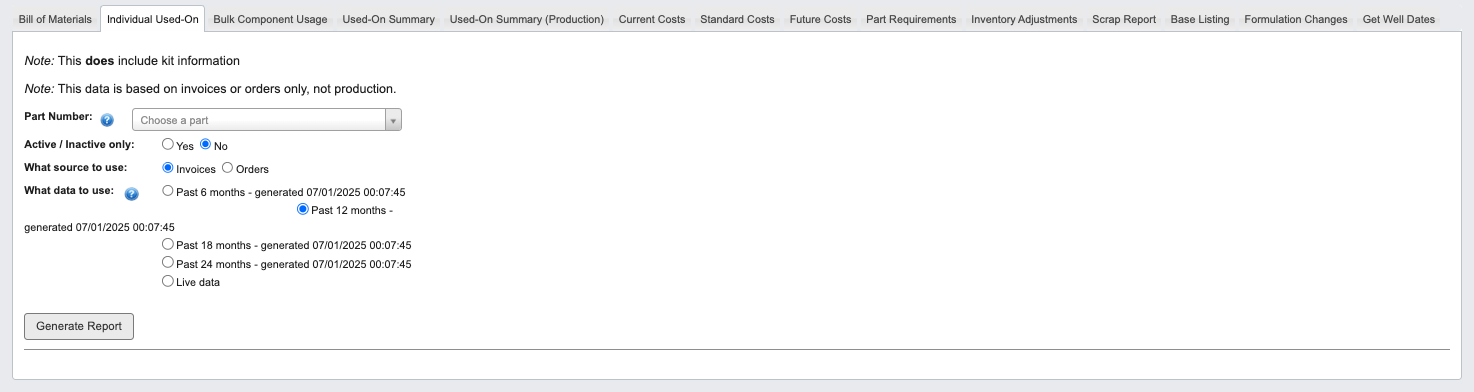
Generate an Individual Used-On report
-
Click the
Individual Used-Ontab. -
Set the required filters:
-
Part Number: Select from manufactured items only. -
Active / Inactive only: Choose Yes or No to filter by part status. -
What source to use: Select Invoices or Orders. -
What data to use: Choose from predefined time periods or Live data.Using live data might take several minutes to generate the used-on report. This in effect re-builds the used-on for all raw material part numbers, and subsequently updates the used-on summary as well.
-
-
Click
Generate Report.
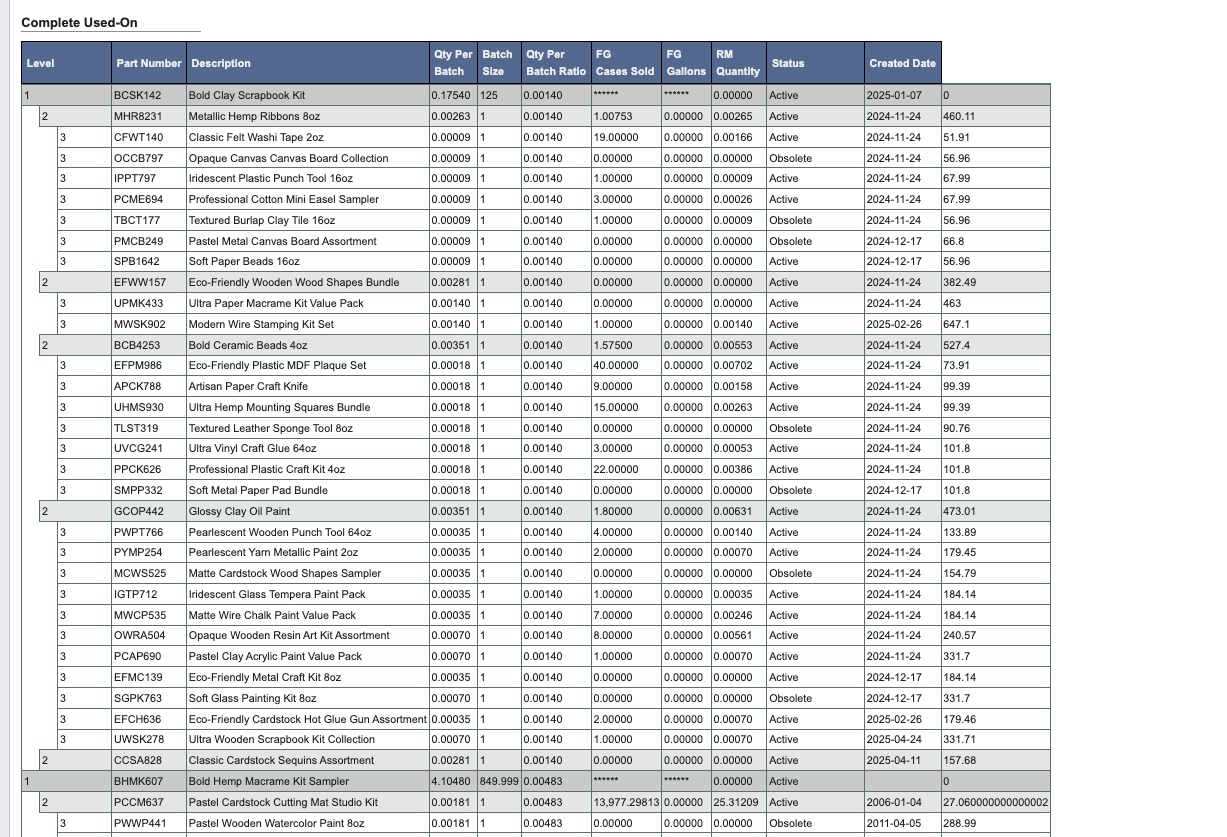
This report includes kit information and is based on invoices or orders only, not production data.
Example Report RM
This report displays three sections: WIPs that use this part, finished goods that use this part, and a complete list of all uses. Note that the complete list may include nested items.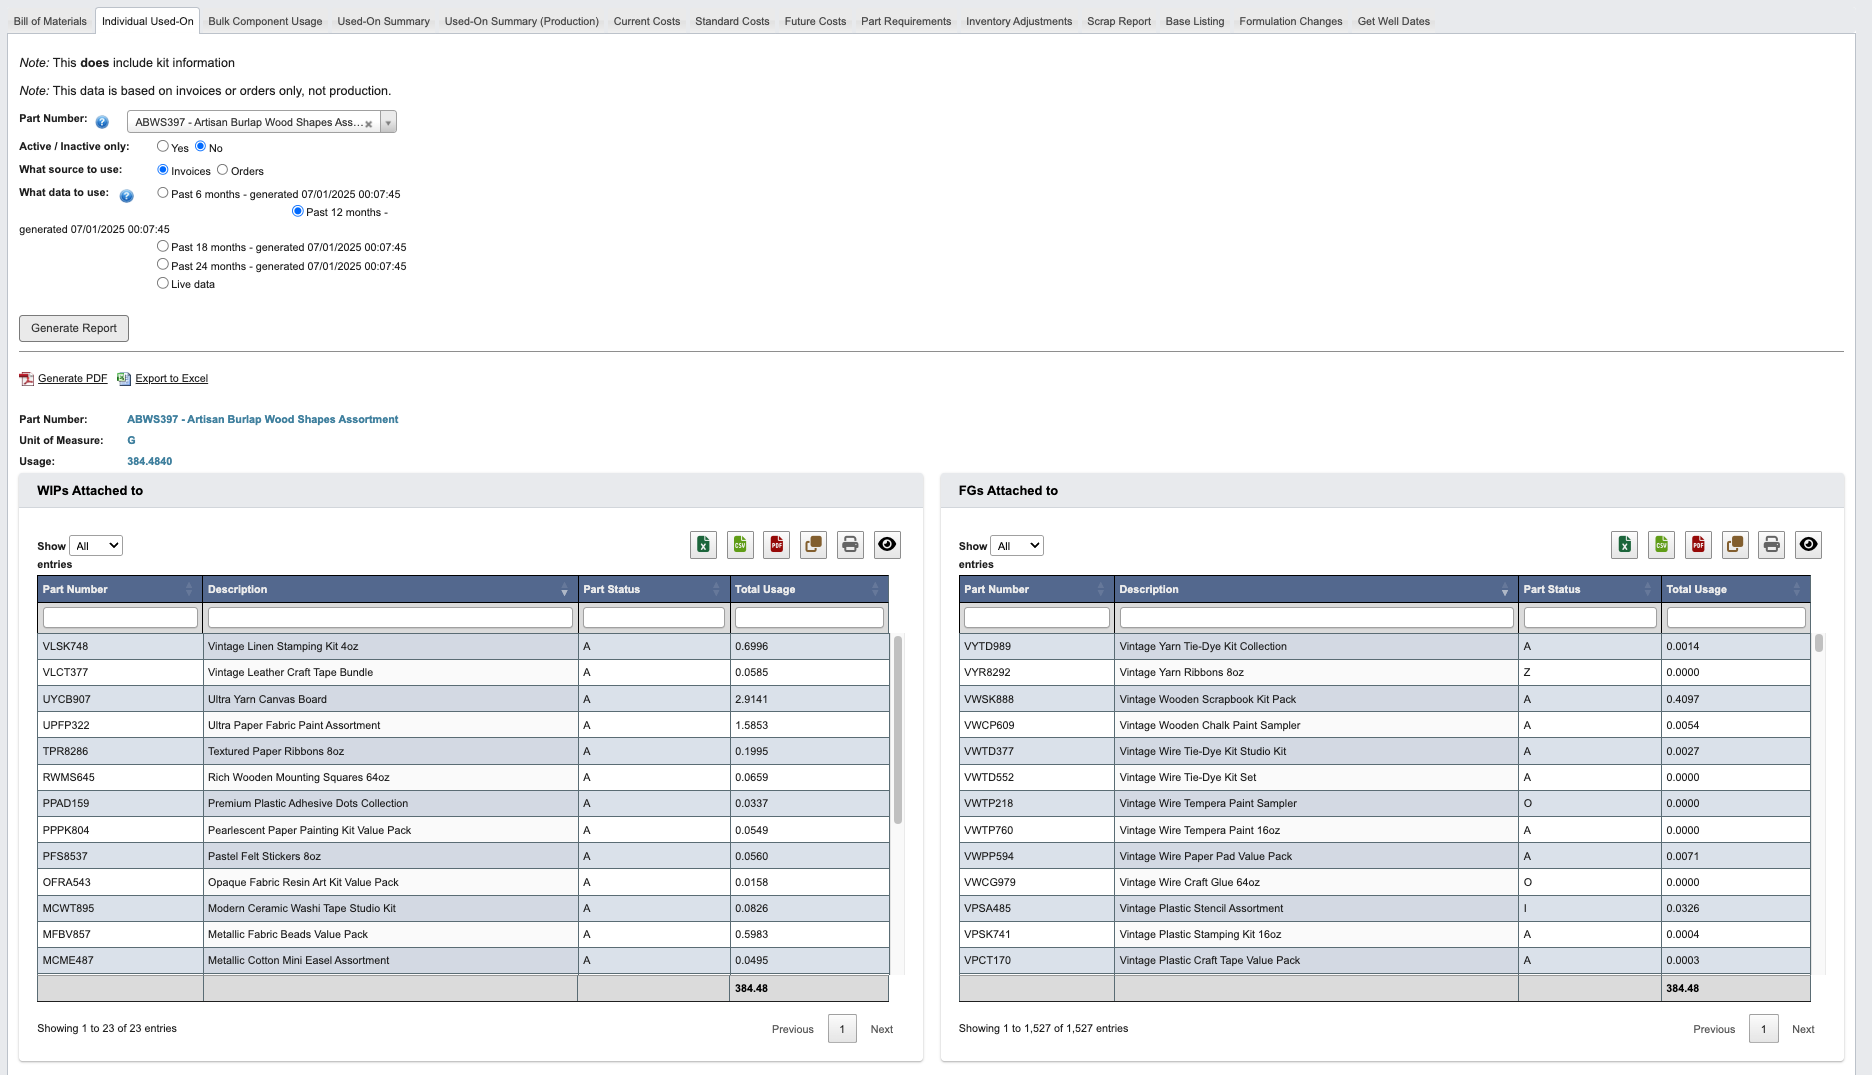
Generate a Bulk Component Usage report
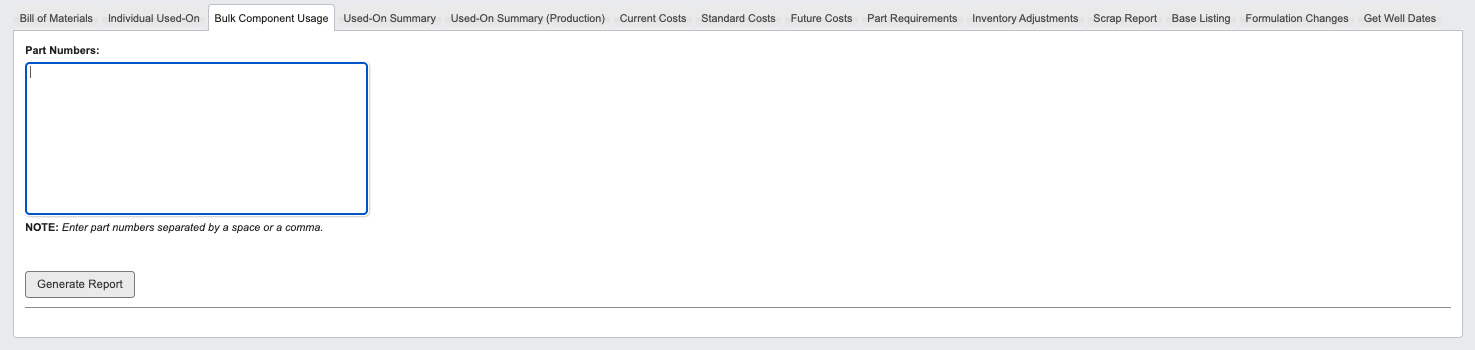
- Click the
Bulk Component Usagetab. - Enter part numbers separated by a space or comma in the input field.
- Click
Generate Report.
Generate a Used-On Summary report
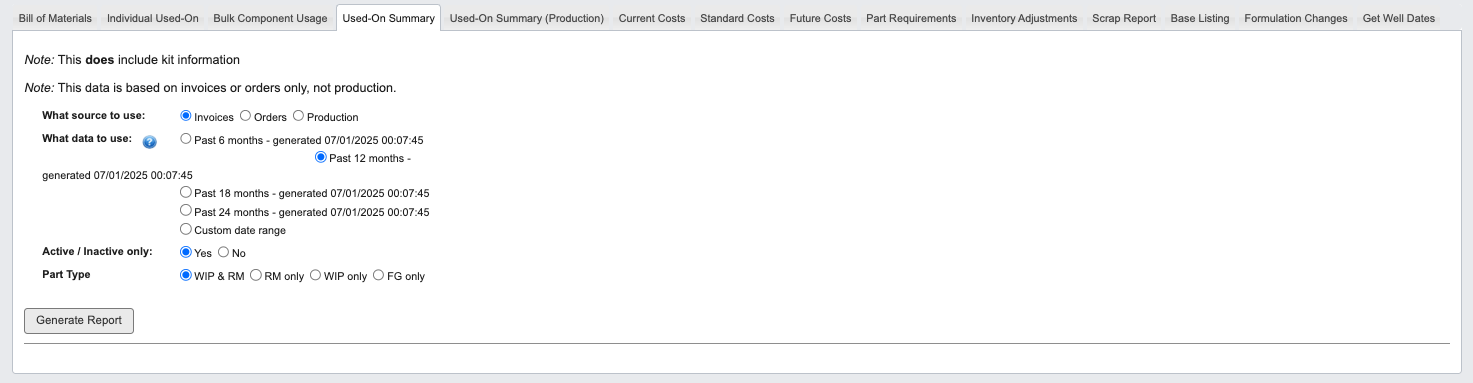
- Click the
Used-On Summarytab. - Set the required filters:
-
What source to use: Choose Invoices, Orders, or Production. -
What data to use: Select from predefined time periods or Custom date range.Using live data might take several minutes to generate the used-on report. This in effect re-builds the used-on for all raw material part numbers, and subsequently updates the used-on summary as well. -
Active / Inactive only: Choose Yes or No. -
Part Type: Select WIP & RM, RM only, WIP only, or FG only.
-
- Click
Generate Report.
This report includes kit information and is based on invoices or orders only, not production data.
Generate a Used-On Summary (Production) report
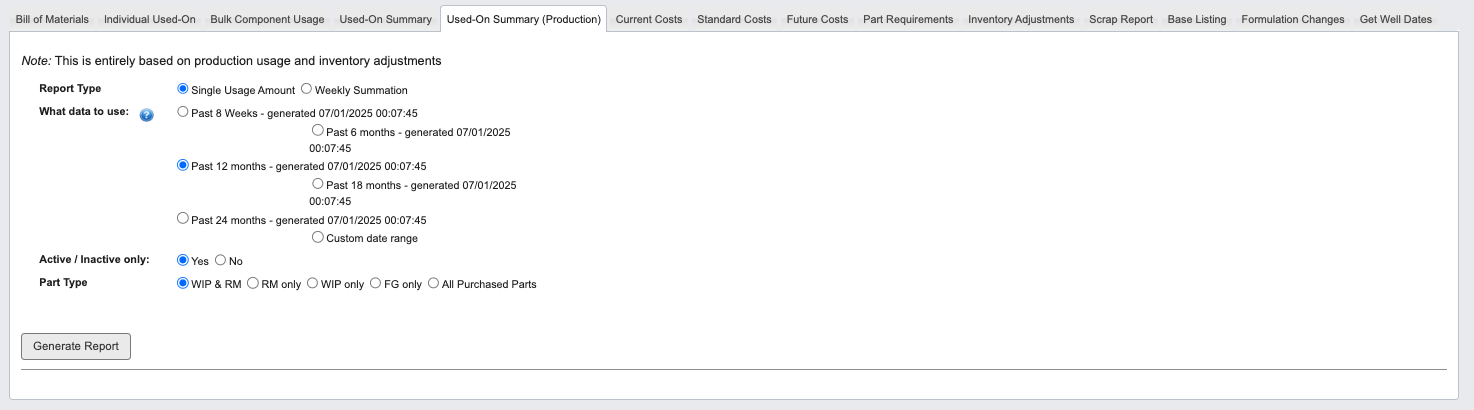
- Click the
Used-On Summary (Production)tab. - Set the required filters:
Report Type: Choose Single Usage Amount or Weekly Summation.What data to use: Select from predefined time periods or Custom date range.Active / Inactive only: Choose Yes or No.Part Type: Select WIP & RM, RM only, WIP only, FG only, or All Purchased Parts.
- Click
Generate Report.
This report is entirely based on production usage and inventory adjustments, providing actual consumption data rather than planned usage.
Generate a Current Costs report
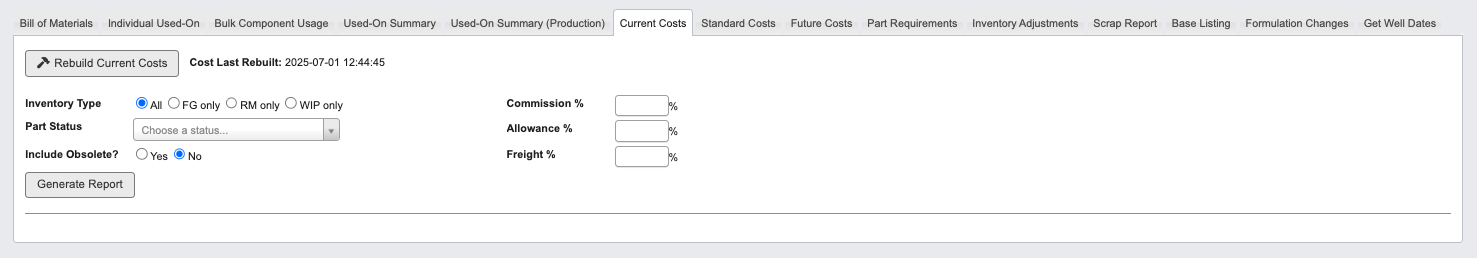
- Click the
Current Coststab. - (Optional) Click
Rebuild Current Coststo refresh cost calculations. - Set the filters:
Inventory Type: Choose All, FG only, RM only, or WIP only.Part Status: Select from A (Active), I (Inactive), O (Obsolete), T (To Be Discontinued), or Z (Draft).Include Obsolete?: Choose Yes or No.Commission %: Enter commission percentage.Allowance %: Enter allowance percentage.Freight %: Enter freight percentage.
- Click
Generate Report.
Generate a Standard Costs report
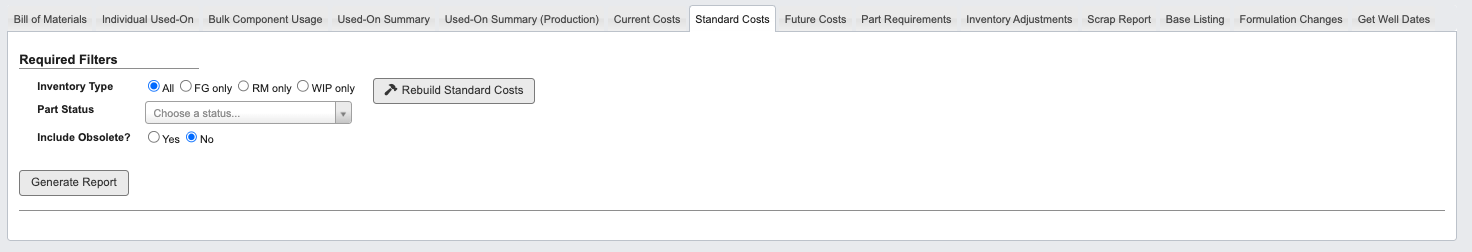
- Click the
Standard Coststab. - (Optional) Click
Rebuild Standard Coststo refresh standard cost calculations. - Set the filters:
Inventory Type: Choose All, FG only, RM only, or WIP only.Part Status: Select from available status options.Include Obsolete?: Choose Yes or No.
- Click
Generate Report.
Generate a Future Costs report
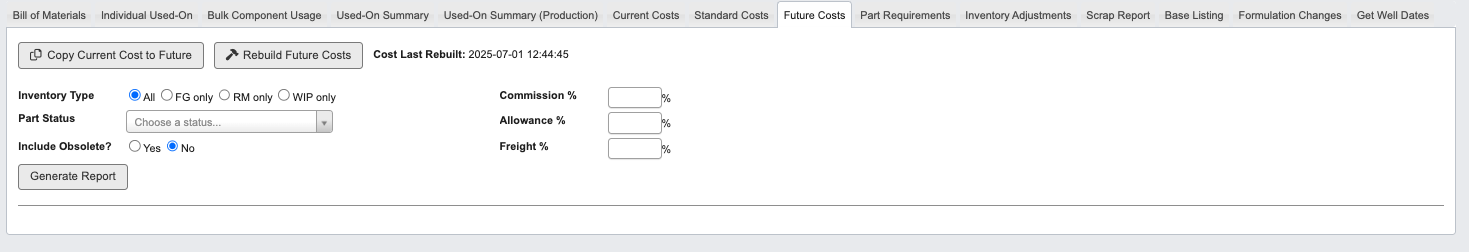
- Click the
Future Coststab. - (Optional) Use action buttons:
- Click
Copy Current Costs to Futureto copy current costs (requires confirmation). - Click
Rebuild Future Coststo refresh future cost calculations.
- Click
- Set the filters:
Inventory Type: Choose All, FG only, RM only, or WIP only.Part Status: Select from available status options.Include Obsolete?: Choose Yes or No.Commission %: Enter commission percentage.Allowance %: Enter allowance percentage.Freight %: Enter freight percentage.
- Click
Generate Report.
Generate a Part Requirements report
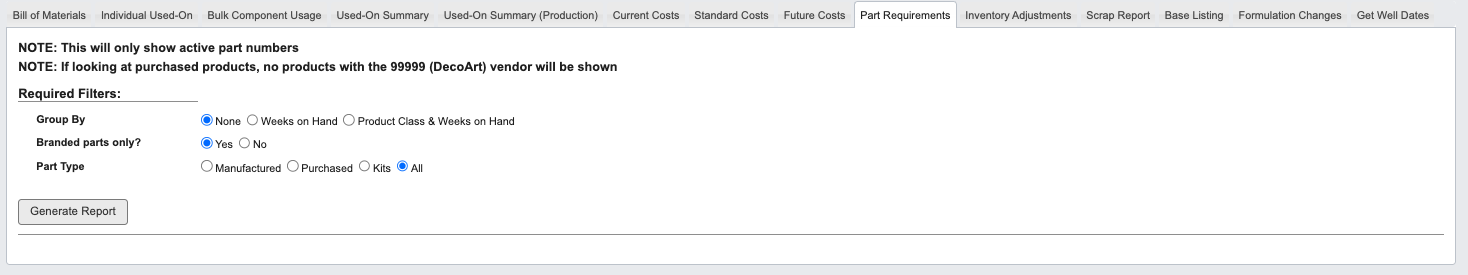
- Click the
Part Requirementstab. - Set the filters:
Group By: Choose None, Weeks on Hand, or Product Class & Weeks on Hand.Branded parts only?: Choose Yes or No.Part Type:Select Manufactured, Purchased, Kits, or All.
- Click
Generate Report.
This report only shows active part numbers. For purchased products, items with the 99999 (DecoArt) vendor will not be shown.
Generate an Inventory Adjustments report
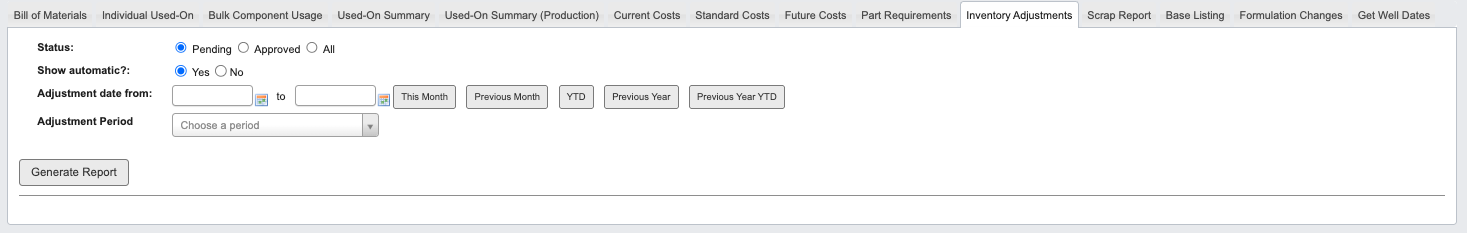
- Click the
Inventory Adjustmentstab. - Set the required filters:
Status: Choose Pending, Approved, or All.Show automatic?: Choose Yes or No.Adjustment date from: Enter required date range.Adjustment Period: Select month and year.
- Click
Generate Report.
Generate a Scrap report
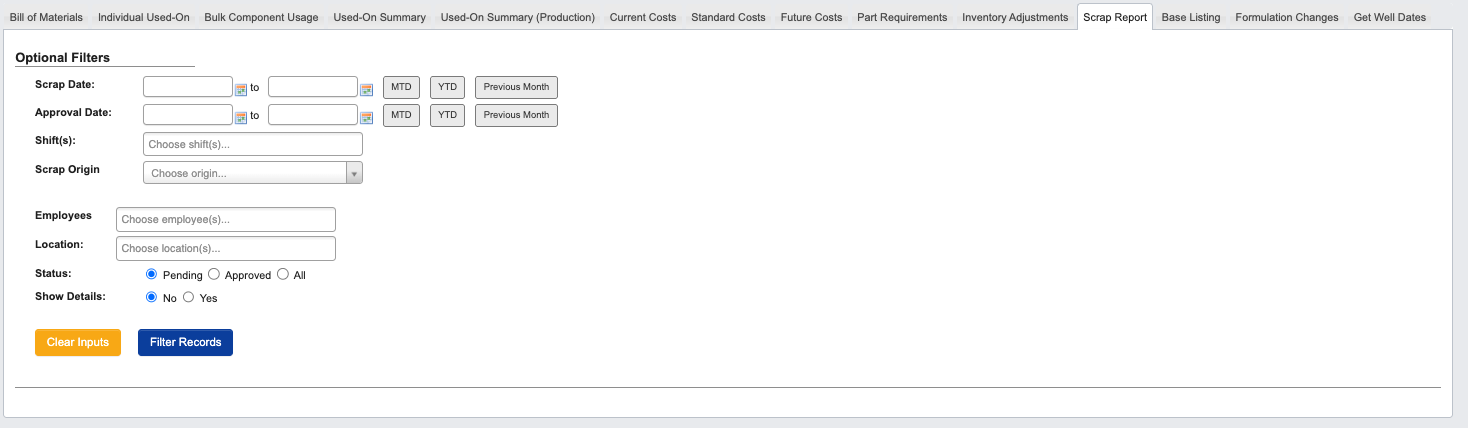
- Click the
Scrap Reporttab. - Set the filters:
Scrap Date: Enter date range.Approval Date: Enter date range.Shift(s): Select from shifts 1, 2, or 3.Scrap Origin: Choose from Dispersion, Bottling, Shrink Wrap, Label Press, Kit, Purchasing, Blister, Rework, Inventory Conversion, Paint Pots, or Half Gallon.Employees: Select specific employees.Location: Enter location.Status: Choose Pending, Approved, or All.Show Details: Select No or Yes.
- Use
Clear Inputsto reset filters orFilter Recordsto apply them.
Generate a Base Listing report
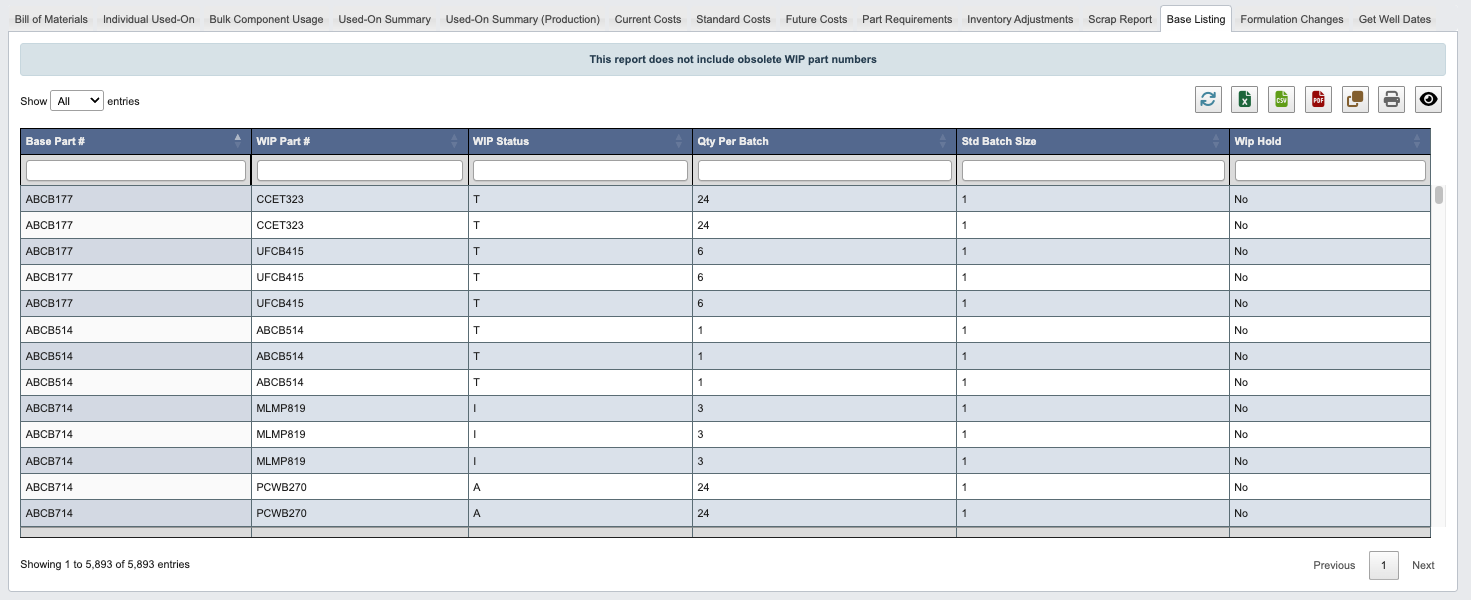
- Click the
Base Listingtab. - Click
Generate Report.
This report does not include obsolete WIP part numbers.
Generate a Formulation Changes report
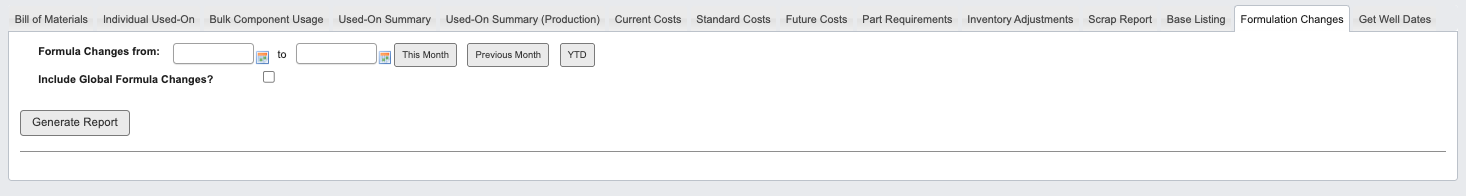
- Click the
Formulation Changestab. - Set the filters:
Formula Changes from: Enter date range.Include Global Formula Changes?: Check the checkbox to include.
- Click
Generate Report.
Generate a Get Well Dates report
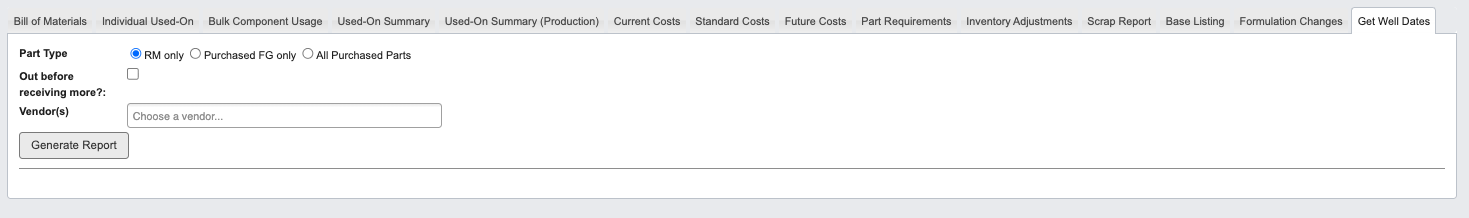
- Click the
Get Well Datestab. - Set the filters:
Part Type: Choose RM only, Purchased FG only, or All Purchased Parts.Out before receiving more?: Check the checkbox to filter.Vendor(s): Select specific vendors.
- Click
Generate Report.